Treemapping
Treemapping[edit]


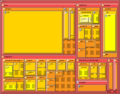
Treemapping is a method for displaying hierarchical data using nested rectangles. This visualization technique is particularly useful for representing the proportions of different categories within a dataset, allowing for easy comparison of sizes and relationships.
History[edit]
Treemapping was first developed by Ben Shneiderman in the early 1990s. The original purpose was to visualize the file systems of computers, where the size of each rectangle represented the size of each file or directory. Over time, treemapping has been adapted for a wide range of applications beyond file systems, including financial analysis, market research, and data journalism.
Design and Features[edit]
Treemaps are constructed by dividing a rectangular display area into smaller rectangles, each representing a branch of the hierarchy. The size of each rectangle is proportional to a specific dimension of the data, such as value or volume. The rectangles can be colored to represent another dimension, such as category or change over time.
Algorithms[edit]
Several algorithms exist for creating treemaps, each with different approaches to dividing the space:
- Slice-and-dice: This method alternates between horizontal and vertical cuts to create rectangles. It is simple but can result in long, thin rectangles that are hard to interpret.
- Squarified treemaps: This algorithm aims to create rectangles that are as square as possible, improving readability and comparison.
- Strip treemaps: This method arranges rectangles in strips, balancing the aspect ratio and maintaining order.
Applications[edit]
Treemaps are used in various fields to visualize complex data:
- Business and finance: Treemaps can display stock market data, showing the performance of different sectors and companies.
- Healthcare: They can represent patient data, such as the distribution of diseases or resource allocation.
- Public policy: Treemaps are used to visualize budget allocations and expenditures.
Advantages and Limitations[edit]
Treemaps offer several advantages, including the ability to display large amounts of data in a compact space and the ease of comparing relative sizes. However, they also have limitations, such as difficulty in representing negative values and challenges in interpreting very small rectangles.
Related Pages[edit]
References[edit]
- Shneiderman, B. (1992). "Tree visualization with tree-maps: 2-d space-filling approach". ACM Transactions on Graphics.
- Johnson, B., & Shneiderman, B. (1991). "Tree-maps: A space-filling approach to the visualization of hierarchical information structures". Proceedings of the IEEE Conference on Visualization.
-
 Treemapping
 -
 Tree Map
 -
 Gray's Anatomy - Brodmann Areas

Ad. Transform your life with W8MD's Budget GLP-1 injections from $75


W8MD offers a medical weight loss program to lose weight in Philadelphia. Our physician-supervised medical weight loss provides:
- Weight loss injections in NYC (generic and brand names):
- Zepbound / Mounjaro, Wegovy / Ozempic, Saxenda
- Most insurances accepted or discounted self-pay rates. We will obtain insurance prior authorizations if needed.
- Generic GLP1 weight loss injections from $75 for the starting dose.
- Also offer prescription weight loss medications including Phentermine, Qsymia, Diethylpropion, Contrave etc.
NYC weight loss doctor appointmentsNYC weight loss doctor appointments
Start your NYC weight loss journey today at our NYC medical weight loss and Philadelphia medical weight loss clinics.
- Call 718-946-5500 to lose weight in NYC or for medical weight loss in Philadelphia 215-676-2334.
- Tags:NYC medical weight loss, Philadelphia lose weight Zepbound NYC, Budget GLP1 weight loss injections, Wegovy Philadelphia, Wegovy NYC, Philadelphia medical weight loss, Brookly weight loss and Wegovy NYC
![]()
![]()
![]()
![]()
|
WikiMD's Wellness Encyclopedia |
| Let Food Be Thy Medicine Medicine Thy Food - Hippocrates |
Medical Disclaimer: WikiMD is not a substitute for professional medical advice. The information on WikiMD is provided as an information resource only, may be incorrect, outdated or misleading, and is not to be used or relied on for any diagnostic or treatment purposes. Please consult your health care provider before making any healthcare decisions or for guidance about a specific medical condition. WikiMD expressly disclaims responsibility, and shall have no liability, for any damages, loss, injury, or liability whatsoever suffered as a result of your reliance on the information contained in this site. By visiting this site you agree to the foregoing terms and conditions, which may from time to time be changed or supplemented by WikiMD. If you do not agree to the foregoing terms and conditions, you should not enter or use this site. See full disclaimer.
Credits:Most images are courtesy of Wikimedia commons, and templates, categories Wikipedia, licensed under CC BY SA or similar.
Translate this page: - East Asian
中文,
日本,
한국어,
South Asian
हिन्दी,
தமிழ்,
తెలుగు,
Urdu,
ಕನ್ನಡ,
Southeast Asian
Indonesian,
Vietnamese,
Thai,
မြန်မာဘာသာ,
বাংলা
European
español,
Deutsch,
français,
Greek,
português do Brasil,
polski,
română,
русский,
Nederlands,
norsk,
svenska,
suomi,
Italian
Middle Eastern & African
عربى,
Turkish,
Persian,
Hebrew,
Afrikaans,
isiZulu,
Kiswahili,
Other
Bulgarian,
Hungarian,
Czech,
Swedish,
മലയാളം,
मराठी,
ਪੰਜਾਬੀ,
ગુજરાતી,
Portuguese,
Ukrainian
