Data and information visualization
Data and Information Visualization[edit]

Data and information visualization is the graphical representation of information and data. By using visual elements like charts, graphs, and maps, data visualization tools provide an accessible way to see and understand trends, outliers, and patterns in data.
History[edit]
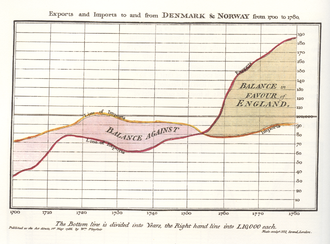
The history of data visualization is rich and varied, dating back to the 17th century. Early examples include the work of William Playfair, who is credited with inventing several types of diagrams, including the line, bar, and pie charts.

In the 19th century, Charles Minard created one of the most famous data visualizations, depicting Napoleon's disastrous Russian campaign of 1812. This map is celebrated for its ability to convey multiple dimensions of data in a single, coherent image.
Principles of Data Visualization[edit]
Effective data visualization is based on several key principles:
- Clarity: The visualization should clearly communicate the data without unnecessary complexity.
- Accuracy: The representation should accurately reflect the data.
- Efficiency: The visualization should allow the viewer to quickly understand the data.
- Aesthetics: While not the primary focus, a visually appealing design can enhance understanding.
Types of Data Visualizations[edit]
There are numerous types of data visualizations, each suited to different kinds of data and analysis:
- Bar Charts: Used to compare quantities across categories.
- Line Charts: Ideal for showing trends over time.
- Pie Charts: Useful for showing proportions.
- Scatter Plots: Used to show relationships between two variables.
- Heat Maps: Display data density or intensity.

The Process of Data Visualization[edit]
The process of creating a data visualization involves several steps:
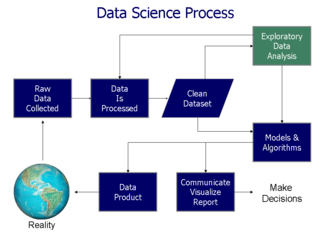
1. Data Collection: Gathering the necessary data from various sources. 2. Data Cleaning: Preparing the data by removing errors and inconsistencies. 3. Data Analysis: Analyzing the data to find patterns and insights. 4. Design: Choosing the appropriate type of visualization and designing it. 5. Implementation: Creating the visualization using software tools.

Applications[edit]
Data visualization is used in a wide range of fields, including:
- Business: For dashboards and reports to monitor performance.
- Science: To visualize complex data sets and model results.
- Healthcare: For tracking patient data and outcomes.
- Education: To enhance learning through visual aids.
Challenges[edit]
Despite its benefits, data visualization also presents challenges:
- Data Quality: Poor quality data can lead to misleading visualizations.
- Over-Simplification: Simplifying data too much can obscure important details.
- Bias: Visualizations can be biased by the choice of data or design.
Future Trends[edit]
The future of data visualization is likely to be shaped by advances in technology, including:
- Interactive Visualizations: Allowing users to explore data dynamically.
- Augmented Reality (AR): Integrating data visualizations into the physical world.
- Machine Learning: Automating the creation of visualizations based on data patterns.

Related Pages[edit]
Ad. Transform your life with W8MD's Budget GLP-1 injections from $75


W8MD offers a medical weight loss program to lose weight in Philadelphia. Our physician-supervised medical weight loss provides:
- Weight loss injections in NYC (generic and brand names):
- Zepbound / Mounjaro, Wegovy / Ozempic, Saxenda
- Most insurances accepted or discounted self-pay rates. We will obtain insurance prior authorizations if needed.
- Generic GLP1 weight loss injections from $75 for the starting dose.
- Also offer prescription weight loss medications including Phentermine, Qsymia, Diethylpropion, Contrave etc.
NYC weight loss doctor appointmentsNYC weight loss doctor appointments
Start your NYC weight loss journey today at our NYC medical weight loss and Philadelphia medical weight loss clinics.
- Call 718-946-5500 to lose weight in NYC or for medical weight loss in Philadelphia 215-676-2334.
- Tags:NYC medical weight loss, Philadelphia lose weight Zepbound NYC, Budget GLP1 weight loss injections, Wegovy Philadelphia, Wegovy NYC, Philadelphia medical weight loss, Brookly weight loss and Wegovy NYC
|
WikiMD's Wellness Encyclopedia |
| Let Food Be Thy Medicine Medicine Thy Food - Hippocrates |
Medical Disclaimer: WikiMD is not a substitute for professional medical advice. The information on WikiMD is provided as an information resource only, may be incorrect, outdated or misleading, and is not to be used or relied on for any diagnostic or treatment purposes. Please consult your health care provider before making any healthcare decisions or for guidance about a specific medical condition. WikiMD expressly disclaims responsibility, and shall have no liability, for any damages, loss, injury, or liability whatsoever suffered as a result of your reliance on the information contained in this site. By visiting this site you agree to the foregoing terms and conditions, which may from time to time be changed or supplemented by WikiMD. If you do not agree to the foregoing terms and conditions, you should not enter or use this site. See full disclaimer.
Credits:Most images are courtesy of Wikimedia commons, and templates, categories Wikipedia, licensed under CC BY SA or similar.
Translate this page: - East Asian
中文,
日本,
한국어,
South Asian
हिन्दी,
தமிழ்,
తెలుగు,
Urdu,
ಕನ್ನಡ,
Southeast Asian
Indonesian,
Vietnamese,
Thai,
မြန်မာဘာသာ,
বাংলা
European
español,
Deutsch,
français,
Greek,
português do Brasil,
polski,
română,
русский,
Nederlands,
norsk,
svenska,
suomi,
Italian
Middle Eastern & African
عربى,
Turkish,
Persian,
Hebrew,
Afrikaans,
isiZulu,
Kiswahili,
Other
Bulgarian,
Hungarian,
Czech,
Swedish,
മലയാളം,
मराठी,
ਪੰਜਾਬੀ,
ગુજરાતી,
Portuguese,
Ukrainian