Phase diagram
A phase diagram in physical chemistry, engineering, and materials science is a type of chart used to show the conditions (pressure, temperature, volume, etc.) under which thermodynamically distinct phases occur and coexist at equilibrium. Phase diagrams provide valuable information about melting, sublimation, boiling points, and the relationships between the solid, liquid, and gaseous states of matter. They are particularly useful in the fields of metallurgy and mineralogy for predicting the structures and compositions of minerals and alloys under different conditions.
Overview[edit]
Phase diagrams are graphical representations that map out the existence of different phases of a substance at various temperatures and pressures. The most common type of phase diagram is the temperature-pressure (T-P) diagram, although volume can also be a variable in more complex diagrams. Each region within a phase diagram represents a phase, and the lines that separate these regions are known as phase boundaries or transition lines, which indicate the conditions under which two phases can coexist in equilibrium.
Key Components[edit]
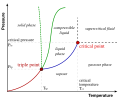
- Critical Point: The point on the phase diagram at which the properties of the gas and liquid phases of a substance become identical and form a single phase known as a supercritical fluid.
- Triple Point: The unique set of conditions at which all three phases (solid, liquid, and gas) of a substance coexist in thermodynamic equilibrium.
- Phase Boundaries: Lines on the phase diagram that mark the conditions under which two different phases can coexist in equilibrium.
- Eutectic Point: The lowest temperature at which a mixture of substances can coexist in a liquid phase.
Types of Phase Diagrams[edit]
- Binary Phase Diagrams: These diagrams represent the phase behavior of two-component systems. They are essential for understanding the melting and solidification behavior of alloys.
- Ternary Phase Diagrams: These involve three components and are more complex, often used in materials science to study the phase behavior of mixtures involving three elements or compounds.
- Pressure-Temperature Diagrams: The most common type, showing how phase transitions vary with changes in temperature and pressure.
Applications[edit]
Phase diagrams are crucial in various scientific and engineering fields. They are used to:
- Predict the conditions under which materials will undergo a phase change.
- Design chemical processes and select materials for specific temperatures and pressures.
- Understand and control the crystallization, melting, and alloying processes in metallurgy.
- Determine the stability and compatibility of components in geological and materials science studies.
See Also[edit]
-
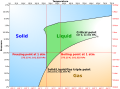 Phase diagram of water simplified
 -
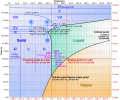
 Phase diagram
 -
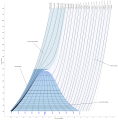
 Mollier enthalpy entropy chart for steam - US units
 -
 Pressure-enthalpy chart for steam, in US units
 -
 Temperature-entropy chart for steam, imperial units
 -
 PVT 3D diagram
 -
 Eutektikum
 -
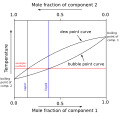 Binary Boiling Point Diagram
 -
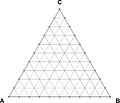 Gibbs triangle ternary plot
 -
 Space diagram of a three-component system
 -
 Phase diagram of water


Medical Disclaimer: WikiMD is for informational purposes only and is not a substitute for professional medical advice. Content may be inaccurate or outdated and should not be used for diagnosis or treatment. Always consult your healthcare provider for medical decisions. Verify information with trusted sources such as CDC.gov and NIH.gov. By using this site, you agree that WikiMD is not liable for any outcomes related to its content. See full disclaimer.
Credits:Most images are courtesy of Wikimedia commons, and templates, categories Wikipedia, licensed under CC BY SA or similar.
Translate page: - East Asian
中文,
日本,
한국어,
South Asian
हिन्दी,
தமிழ்,
తెలుగు,
Urdu,
ಕನ್ನಡ,
Southeast Asian
Indonesian,
Vietnamese,
Thai,
မြန်မာဘာသာ,
বাংলা
European
español,
Deutsch,
français,
Greek,
português do Brasil,
polski,
română,
русский,
Nederlands,
norsk,
svenska,
suomi,
Italian
Middle Eastern & African
عربى,
Turkish,
Persian,
Hebrew,
Afrikaans,
isiZulu,
Kiswahili,
Other
Bulgarian,
Hungarian,
Czech,
Swedish,
മലയാളം,
मराठी,
ਪੰਜਾਬੀ,
ગુજરાતી,
Portuguese,
Ukrainian
