Air quality index
Air Quality Index
The Air Quality Index (AQI) is a numerical scale used to communicate how polluted the air currently is or how polluted it is forecast to become. Public health risks increase as the AQI rises, especially for sensitive groups such as children, the elderly, and those with pre-existing health conditions.
Components of the AQI[edit]
The AQI is calculated based on the concentrations of several major air pollutants regulated by the Clean Air Act. These pollutants include:
- Particulate matter (PM10 and PM2.5)
- Ozone (O3)
- Nitrogen dioxide (NO2)
- Sulfur dioxide (SO2)
- Carbon monoxide (CO)
Each of these pollutants has its own scale, and the highest of these values determines the overall AQI.
Health Implications[edit]
The AQI is divided into categories that correspond to different levels of health concern:
- 0-50: Good
- 51-100: Moderate
- 101-150: Unhealthy for sensitive groups
- 151-200: Unhealthy
- 201-300: Very unhealthy
- 301-500: Hazardous
Each category is associated with a specific color to make it easier for the public to understand the level of health concern.
Measurement and Reporting[edit]
Air quality is measured using a variety of instruments that detect the concentration of pollutants in the air. These measurements are then converted into the AQI using standard formulas. In many cities, air quality is monitored by government agencies and reported to the public through various media, including websites, apps, and roadside displays.
Global Variations[edit]
Different countries have their own methods for calculating the AQI, which can lead to variations in how air quality is reported. For example, the United States Environmental Protection Agency (EPA) uses a specific formula, while countries like India have their own systems that may include additional pollutants or different thresholds.
Related pages[edit]
Gallery[edit]
-
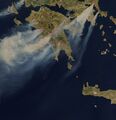 Smoke from wildfires can significantly impact air quality.
 -
An air quality measurement station in Edinburgh.
-
 A signboard displaying air quality information in Houston.
 -
Components of AQI computation for India.
-
Visualization of PM2.5 levels.
-
Global map of air pollution levels.


Medical Disclaimer: WikiMD is for informational purposes only and is not a substitute for professional medical advice. Content may be inaccurate or outdated and should not be used for diagnosis or treatment. Always consult your healthcare provider for medical decisions. Verify information with trusted sources such as CDC.gov and NIH.gov. By using this site, you agree that WikiMD is not liable for any outcomes related to its content. See full disclaimer.
Credits:Most images are courtesy of Wikimedia commons, and templates, categories Wikipedia, licensed under CC BY SA or similar.
Translate page: - East Asian
中文,
日本,
한국어,
South Asian
हिन्दी,
தமிழ்,
తెలుగు,
Urdu,
ಕನ್ನಡ,
Southeast Asian
Indonesian,
Vietnamese,
Thai,
မြန်မာဘာသာ,
বাংলা
European
español,
Deutsch,
français,
Greek,
português do Brasil,
polski,
română,
русский,
Nederlands,
norsk,
svenska,
suomi,
Italian
Middle Eastern & African
عربى,
Turkish,
Persian,
Hebrew,
Afrikaans,
isiZulu,
Kiswahili,
Other
Bulgarian,
Hungarian,
Czech,
Swedish,
മലയാളം,
मराठी,
ਪੰਜਾਬੀ,
ગુજરાતી,
Portuguese,
Ukrainian
