Cardiac function curve: Difference between revisions
CSV import |
CSV import |
||
| Line 33: | Line 33: | ||
[[Category:Medical diagrams]] | [[Category:Medical diagrams]] | ||
{{Medicine-stub}} | {{Medicine-stub}} | ||
<gallery> | |||
File:Cardiacfunctioncurve.png|Cardiac function curve | |||
File:Starling_RAP_combined.svg|Starling RAP combined | |||
File:Frank_Starling’s_curve.png|Frank Starling’s curve | |||
File:Cardiac_and_vascular_function_curves.png|Cardiac and vascular function curves | |||
</gallery> | |||
Revision as of 04:47, 18 February 2025
Cardiac Function Curve is a graphical representation of the relationship between cardiac output and venous return. It is a fundamental concept in cardiovascular physiology, providing insights into the mechanisms that regulate cardiac output and blood pressure.
Overview
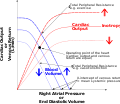
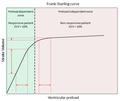
The cardiac function curve is derived from the Frank-Starling law, which states that the stroke volume of the heart increases in response to an increase in the volume of blood filling the heart (the end diastolic volume) when all other factors remain constant. This relationship is depicted on the curve, with cardiac output (the volume of blood pumped by the heart per minute) on the y-axis and right atrial pressure (a surrogate for venous return) on the x-axis.
Components of the Cardiac Function Curve
The cardiac function curve consists of two main components: the cardiac output curve and the venous return curve.
Cardiac Output Curve
The cardiac output curve represents the heart's ability to pump blood. It is influenced by factors such as heart rate, myocardial contractility, and afterload. An increase in any of these factors shifts the curve upwards, indicating an increase in cardiac output for a given right atrial pressure.
Venous Return Curve
The venous return curve represents the amount of blood returning to the heart. It is influenced by factors such as blood volume, venous compliance, and resistance to blood flow. An increase in any of these factors shifts the curve to the right, indicating an increase in venous return for a given right atrial pressure.
Clinical Significance
The cardiac function curve is a valuable tool in understanding the pathophysiology of various cardiovascular conditions. For example, in heart failure, the cardiac output curve shifts downwards, indicating a decrease in the heart's ability to pump blood. Conversely, in conditions such as hypervolemia or venous insufficiency, the venous return curve shifts to the right, indicating an increase in the volume of blood returning to the heart.
See Also

-
Cardiac function curve
-
 Starling RAP combined
 -
 Frank Starling’s curve
 -
 Cardiac and vascular function curves


