Treemapping: Difference between revisions
CSV import |
CSV import |
||
| Line 37: | Line 37: | ||
[[Category:Data visualization]] | [[Category:Data visualization]] | ||
<gallery> | |||
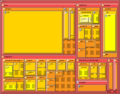
File:2012_Singapore_Products_Export_Treemap.png|Treemapping | |||
File:Tree_Map.png|Tree Map | |||
File:Gray727-Brodman.png|Gray's Anatomy - Brodmann Areas | |||
</gallery> | |||
Latest revision as of 01:20, 18 February 2025
Treemapping[edit]


Treemapping is a method for displaying hierarchical data using nested rectangles. This visualization technique is particularly useful for representing the proportions of different categories within a dataset, allowing for easy comparison of sizes and relationships.
History[edit]
Treemapping was first developed by Ben Shneiderman in the early 1990s. The original purpose was to visualize the file systems of computers, where the size of each rectangle represented the size of each file or directory. Over time, treemapping has been adapted for a wide range of applications beyond file systems, including financial analysis, market research, and data journalism.
Design and Features[edit]
Treemaps are constructed by dividing a rectangular display area into smaller rectangles, each representing a branch of the hierarchy. The size of each rectangle is proportional to a specific dimension of the data, such as value or volume. The rectangles can be colored to represent another dimension, such as category or change over time.
Algorithms[edit]
Several algorithms exist for creating treemaps, each with different approaches to dividing the space:
- Slice-and-dice: This method alternates between horizontal and vertical cuts to create rectangles. It is simple but can result in long, thin rectangles that are hard to interpret.
- Squarified treemaps: This algorithm aims to create rectangles that are as square as possible, improving readability and comparison.
- Strip treemaps: This method arranges rectangles in strips, balancing the aspect ratio and maintaining order.
Applications[edit]
Treemaps are used in various fields to visualize complex data:
- Business and finance: Treemaps can display stock market data, showing the performance of different sectors and companies.
- Healthcare: They can represent patient data, such as the distribution of diseases or resource allocation.
- Public policy: Treemaps are used to visualize budget allocations and expenditures.
Advantages and Limitations[edit]
Treemaps offer several advantages, including the ability to display large amounts of data in a compact space and the ease of comparing relative sizes. However, they also have limitations, such as difficulty in representing negative values and challenges in interpreting very small rectangles.
Related Pages[edit]
References[edit]
- Shneiderman, B. (1992). "Tree visualization with tree-maps: 2-d space-filling approach". ACM Transactions on Graphics.
- Johnson, B., & Shneiderman, B. (1991). "Tree-maps: A space-filling approach to the visualization of hierarchical information structures". Proceedings of the IEEE Conference on Visualization.
-
 Treemapping
 -
 Tree Map
 -
 Gray's Anatomy - Brodmann Areas

