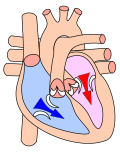
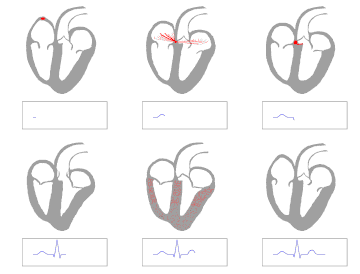
Wiggers diagram
Vestibulocerebellar tract is a part of the central nervous system that connects the vestibular nuclei in the brainstem to the cerebellum. This tract plays a crucial role in maintaining balance and coordinating eye movements.
Function[edit]
The vestibulocerebellar tract carries information from the vestibular system in the inner ear to the cerebellum. This information is used to coordinate balance and eye movements. The tract is particularly important for maintaining balance while moving and for coordinating the movements of the eyes with those of the head.
Anatomy[edit]
The vestibulocerebellar tract originates in the vestibular nuclei, which are located in the brainstem. From there, it travels to the cerebellum, where it terminates. The tract is made up of axons that carry information from the vestibular system to the cerebellum.
Clinical significance[edit]
Damage to the vestibulocerebellar tract can result in a variety of symptoms, including dizziness, vertigo, and problems with balance and coordination. These symptoms can be caused by a variety of conditions, including stroke, multiple sclerosis, and brain tumors. Treatment for these conditions often involves physical therapy to help improve balance and coordination.
See also[edit]
Ad. Transform your life with W8MD's Budget GLP-1 injections from $75


W8MD offers a medical weight loss program to lose weight in Philadelphia. Our physician-supervised medical weight loss provides:
- Weight loss injections in NYC (generic and brand names):
- Zepbound / Mounjaro, Wegovy / Ozempic, Saxenda
- Most insurances accepted or discounted self-pay rates. We will obtain insurance prior authorizations if needed.
- Generic GLP1 weight loss injections from $75 for the starting dose.
- Also offer prescription weight loss medications including Phentermine, Qsymia, Diethylpropion, Contrave etc.
NYC weight loss doctor appointmentsNYC weight loss doctor appointments
Start your NYC weight loss journey today at our NYC medical weight loss and Philadelphia medical weight loss clinics.
- Call 718-946-5500 to lose weight in NYC or for medical weight loss in Philadelphia 215-676-2334.
- Tags:NYC medical weight loss, Philadelphia lose weight Zepbound NYC, Budget GLP1 weight loss injections, Wegovy Philadelphia, Wegovy NYC, Philadelphia medical weight loss, Brookly weight loss and Wegovy NYC
|
WikiMD's Wellness Encyclopedia |
| Let Food Be Thy Medicine Medicine Thy Food - Hippocrates |
Medical Disclaimer: WikiMD is not a substitute for professional medical advice. The information on WikiMD is provided as an information resource only, may be incorrect, outdated or misleading, and is not to be used or relied on for any diagnostic or treatment purposes. Please consult your health care provider before making any healthcare decisions or for guidance about a specific medical condition. WikiMD expressly disclaims responsibility, and shall have no liability, for any damages, loss, injury, or liability whatsoever suffered as a result of your reliance on the information contained in this site. By visiting this site you agree to the foregoing terms and conditions, which may from time to time be changed or supplemented by WikiMD. If you do not agree to the foregoing terms and conditions, you should not enter or use this site. See full disclaimer.
Credits:Most images are courtesy of Wikimedia commons, and templates, categories Wikipedia, licensed under CC BY SA or similar.
Translate this page: - East Asian
中文,
日本,
한국어,
South Asian
हिन्दी,
தமிழ்,
తెలుగు,
Urdu,
ಕನ್ನಡ,
Southeast Asian
Indonesian,
Vietnamese,
Thai,
မြန်မာဘာသာ,
বাংলা
European
español,
Deutsch,
français,
Greek,
português do Brasil,
polski,
română,
русский,
Nederlands,
norsk,
svenska,
suomi,
Italian
Middle Eastern & African
عربى,
Turkish,
Persian,
Hebrew,
Afrikaans,
isiZulu,
Kiswahili,
Other
Bulgarian,
Hungarian,
Czech,
Swedish,
മലയാളം,
मराठी,
ਪੰਜਾਬੀ,
ગુજરાતી,
Portuguese,
Ukrainian


