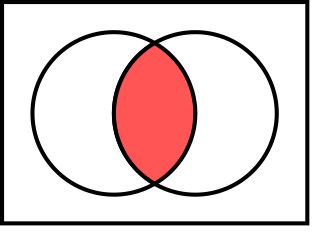
Venn diagram


Venn diagram is a schematic diagram used in mathematics, logic, statistics, and computer science to represent the relationships between sets. Invented in 1880 by John Venn, a British logician and philosopher, Venn diagrams are collections of multiple overlapping closed curves, usually circles, each representing a set. The points inside a curve labeled with a given set represent elements of the set, while points outside the boundary represent elements not in the set. The intersections of the curves represent the set of elements common to the sets.
Overview[edit]
Venn diagrams are used to visually demonstrate the relationships between different sets, allowing for an easy comparison of the sets, their intersections, and differences. They are particularly useful in illustrating simple relationships in probability, logic, statistics, and set theory and are widely used in teaching these subjects.
Construction and Interpretation[edit]
A Venn diagram consists of multiple overlapping circles or other shapes, each representing a set. The most common Venn diagram depicts two or three sets, but diagrams can represent any number of sets. The spatial relations between the areas bounded by the curves correspond to set-theoretical relations. For example, the area where two circles overlap represents the intersection of the two sets.
Symbols and Notation[edit]
In Venn diagrams, sets are usually represented by circles. The universal set (if applicable) is represented by a rectangle enclosing all the circles. The absence of an area's shading or the presence of a particular color or pattern within an area can indicate the presence or absence of certain elements within the sets.
Applications[edit]
Venn diagrams have a wide range of applications:
- In mathematics, they are used to illustrate simple set relationships in probability, logic, and set theory.
- In statistics, Venn diagrams are useful for showing relationships among different data sets, making them valuable tools in descriptive statistics.
- In computer science, Venn diagrams help visualize algorithms and database characteristics.
- In logic, they are used to illustrate propositions, logical relationships, and the structure of arguments.
Limitations[edit]
While Venn diagrams are valuable for representing basic set relationships, they have limitations. They can become overly complex and hard to interpret with more than three sets. Additionally, they are not well-suited for illustrating quantitative data.
Variations[edit]
Several variations of Venn diagrams exist, including:
- Euler diagrams, which are similar to Venn diagrams but only show relevant relationships (not all possible logical relations).
- Karnaugh maps, used in digital logic to simplify algebra expressions.
- Spider diagrams, which extend Venn diagrams by adding existential points.
See Also[edit]

This article is a mathematics-related stub. You can help WikiMD by expanding it!
Ad. Transform your life with W8MD's Budget GLP-1 injections from $49.99


W8MD offers a medical weight loss program to lose weight in Philadelphia. Our physician-supervised medical weight loss provides:
- Weight loss injections in NYC (generic and brand names):
- Zepbound / Mounjaro, Wegovy / Ozempic, Saxenda
- Most insurances accepted or discounted self-pay rates. We will obtain insurance prior authorizations if needed.
- Generic GLP1 weight loss injections from $49.99 for the starting dose of Semaglutide and $65.00 for Tirzepatide.
- Also offer prescription weight loss medications including Phentermine, Qsymia, Diethylpropion, Contrave etc.
NYC weight loss doctor appointmentsNYC weight loss doctor appointments
Start your NYC weight loss journey today at our NYC medical weight loss and Philadelphia medical weight loss clinics.
- Call 718-946-5500 to lose weight in NYC or for medical weight loss in Philadelphia 215-676-2334.
- Tags:NYC medical weight loss, Philadelphia lose weight Zepbound NYC, Budget GLP1 weight loss injections, Wegovy Philadelphia, Wegovy NYC, Philadelphia medical weight loss, Brookly weight loss and Wegovy NYC
|
WikiMD's Wellness Encyclopedia |
| Let Food Be Thy Medicine Medicine Thy Food - Hippocrates |
Medical Disclaimer: WikiMD is not a substitute for professional medical advice. The information on WikiMD is provided as an information resource only, may be incorrect, outdated or misleading, and is not to be used or relied on for any diagnostic or treatment purposes. Please consult your health care provider before making any healthcare decisions or for guidance about a specific medical condition. WikiMD expressly disclaims responsibility, and shall have no liability, for any damages, loss, injury, or liability whatsoever suffered as a result of your reliance on the information contained in this site. By visiting this site you agree to the foregoing terms and conditions, which may from time to time be changed or supplemented by WikiMD. If you do not agree to the foregoing terms and conditions, you should not enter or use this site. See full disclaimer.
Credits:Most images are courtesy of Wikimedia commons, and templates, categories Wikipedia, licensed under CC BY SA or similar.
Translate this page: - East Asian
中文,
日本,
한국어,
South Asian
हिन्दी,
தமிழ்,
తెలుగు,
Urdu,
ಕನ್ನಡ,
Southeast Asian
Indonesian,
Vietnamese,
Thai,
မြန်မာဘာသာ,
বাংলা
European
español,
Deutsch,
français,
Greek,
português do Brasil,
polski,
română,
русский,
Nederlands,
norsk,
svenska,
suomi,
Italian
Middle Eastern & African
عربى,
Turkish,
Persian,
Hebrew,
Afrikaans,
isiZulu,
Kiswahili,
Other
Bulgarian,
Hungarian,
Czech,
Swedish,
മലയാളം,
मराठी,
ਪੰਜਾਬੀ,
ગુજરાતી,
Portuguese,
Ukrainian