Funnel plot

Graphical tool for detecting bias in meta-analyses
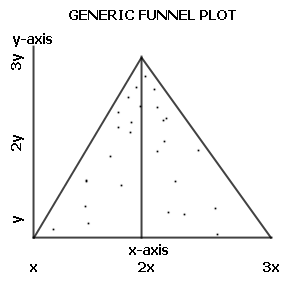
A funnel plot is a type of scatter plot used primarily in meta-analysis to check for the presence of publication bias or other types of bias. The plot is a simple graphical representation that helps to visualize the relationship between study size and effect size.
Structure[edit]
A funnel plot typically plots the effect size from individual studies on the horizontal axis against a measure of study size, such as the standard error or the sample size, on the vertical axis. The name "funnel plot" comes from the shape that is expected when there is no bias: the plot should resemble a symmetrical inverted funnel.
Interpretation[edit]
In the absence of bias, the plot should be symmetrical because smaller studies will scatter widely at the bottom of the graph, with the spread narrowing among larger studies at the top. If there is publication bias, the plot will often appear asymmetrical because studies with non-significant or unfavorable results are less likely to be published.
Applications[edit]
Funnel plots are widely used in systematic reviews and meta-analyses to assess the risk of bias. They are particularly useful in the field of medicine, where they help to ensure that the conclusions drawn from a meta-analysis are not unduly influenced by the selective publication of studies.
Limitations[edit]
While funnel plots are a useful tool, they are not without limitations. Asymmetry in a funnel plot can be caused by factors other than publication bias, such as true heterogeneity between study results, differences in study quality, or chance. Therefore, funnel plots should be interpreted with caution and in conjunction with other methods of bias detection.
See also[edit]
References[edit]
<references group="" responsive="1"></references>
External links[edit]
Ad. Transform your life with W8MD's Budget GLP-1 injections from $75


W8MD offers a medical weight loss program to lose weight in Philadelphia. Our physician-supervised medical weight loss provides:
- Weight loss injections in NYC (generic and brand names):
- Zepbound / Mounjaro, Wegovy / Ozempic, Saxenda
- Most insurances accepted or discounted self-pay rates. We will obtain insurance prior authorizations if needed.
- Generic GLP1 weight loss injections from $75 for the starting dose.
- Also offer prescription weight loss medications including Phentermine, Qsymia, Diethylpropion, Contrave etc.
NYC weight loss doctor appointmentsNYC weight loss doctor appointments
Start your NYC weight loss journey today at our NYC medical weight loss and Philadelphia medical weight loss clinics.
- Call 718-946-5500 to lose weight in NYC or for medical weight loss in Philadelphia 215-676-2334.
- Tags:NYC medical weight loss, Philadelphia lose weight Zepbound NYC, Budget GLP1 weight loss injections, Wegovy Philadelphia, Wegovy NYC, Philadelphia medical weight loss, Brookly weight loss and Wegovy NYC
|
WikiMD's Wellness Encyclopedia |
| Let Food Be Thy Medicine Medicine Thy Food - Hippocrates |
Medical Disclaimer: WikiMD is not a substitute for professional medical advice. The information on WikiMD is provided as an information resource only, may be incorrect, outdated or misleading, and is not to be used or relied on for any diagnostic or treatment purposes. Please consult your health care provider before making any healthcare decisions or for guidance about a specific medical condition. WikiMD expressly disclaims responsibility, and shall have no liability, for any damages, loss, injury, or liability whatsoever suffered as a result of your reliance on the information contained in this site. By visiting this site you agree to the foregoing terms and conditions, which may from time to time be changed or supplemented by WikiMD. If you do not agree to the foregoing terms and conditions, you should not enter or use this site. See full disclaimer.
Credits:Most images are courtesy of Wikimedia commons, and templates, categories Wikipedia, licensed under CC BY SA or similar.
Translate this page: - East Asian
中文,
日本,
한국어,
South Asian
हिन्दी,
தமிழ்,
తెలుగు,
Urdu,
ಕನ್ನಡ,
Southeast Asian
Indonesian,
Vietnamese,
Thai,
မြန်မာဘာသာ,
বাংলা
European
español,
Deutsch,
français,
Greek,
português do Brasil,
polski,
română,
русский,
Nederlands,
norsk,
svenska,
suomi,
Italian
Middle Eastern & African
عربى,
Turkish,
Persian,
Hebrew,
Afrikaans,
isiZulu,
Kiswahili,
Other
Bulgarian,
Hungarian,
Czech,
Swedish,
മലയാളം,
मराठी,
ਪੰਜਾਬੀ,
ગુજરાતી,
Portuguese,
Ukrainian
