File:WHO Covid rn confirmed,deaths European Region05.pdf
From WikiMD's medical encyclopedia
Size of this JPG preview of this PDF file: 800 × 473 pixels. Other resolutions: 320 × 189 pixels | 640 × 378 pixels | 1,024 × 605 pixels | 1,280 × 756 pixels | 3,300 × 1,950 pixels.
Original file (3,300 × 1,950 pixels, file size: 31 KB, MIME type: application/pdf)
Summary
| Description |
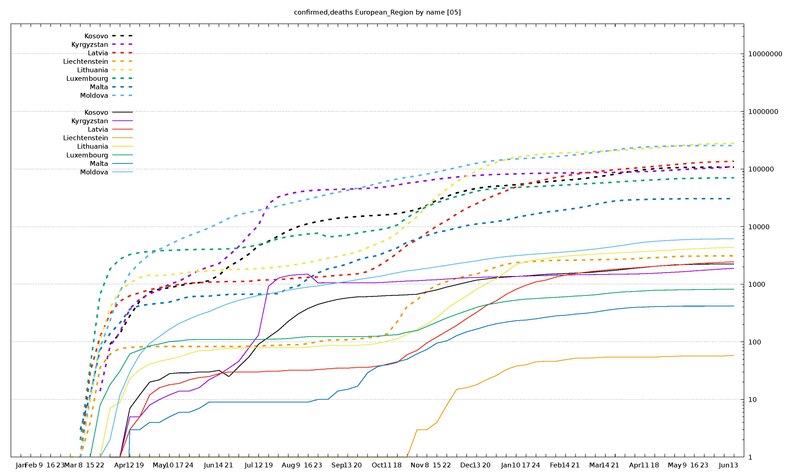
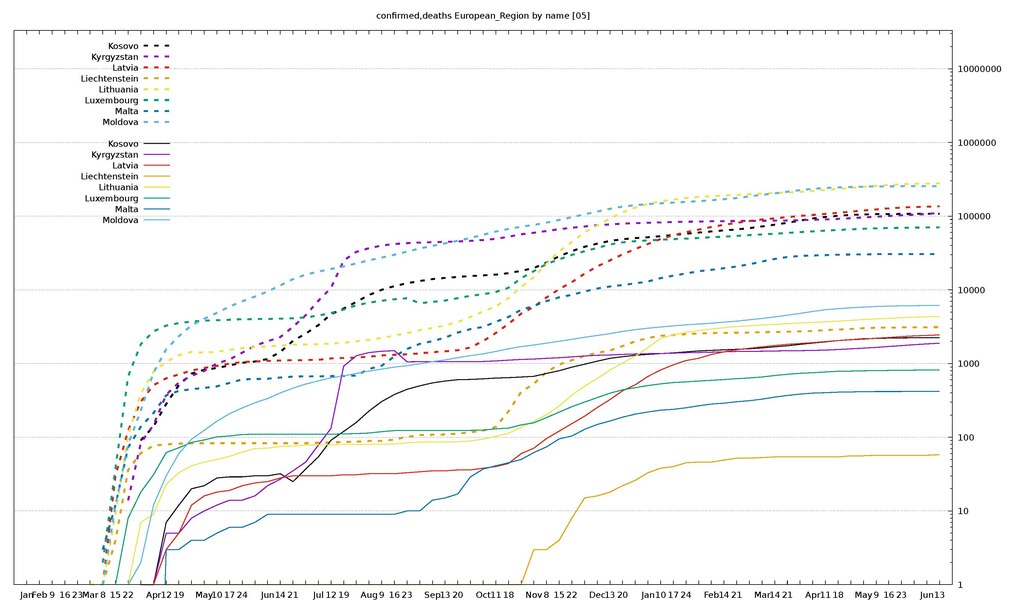
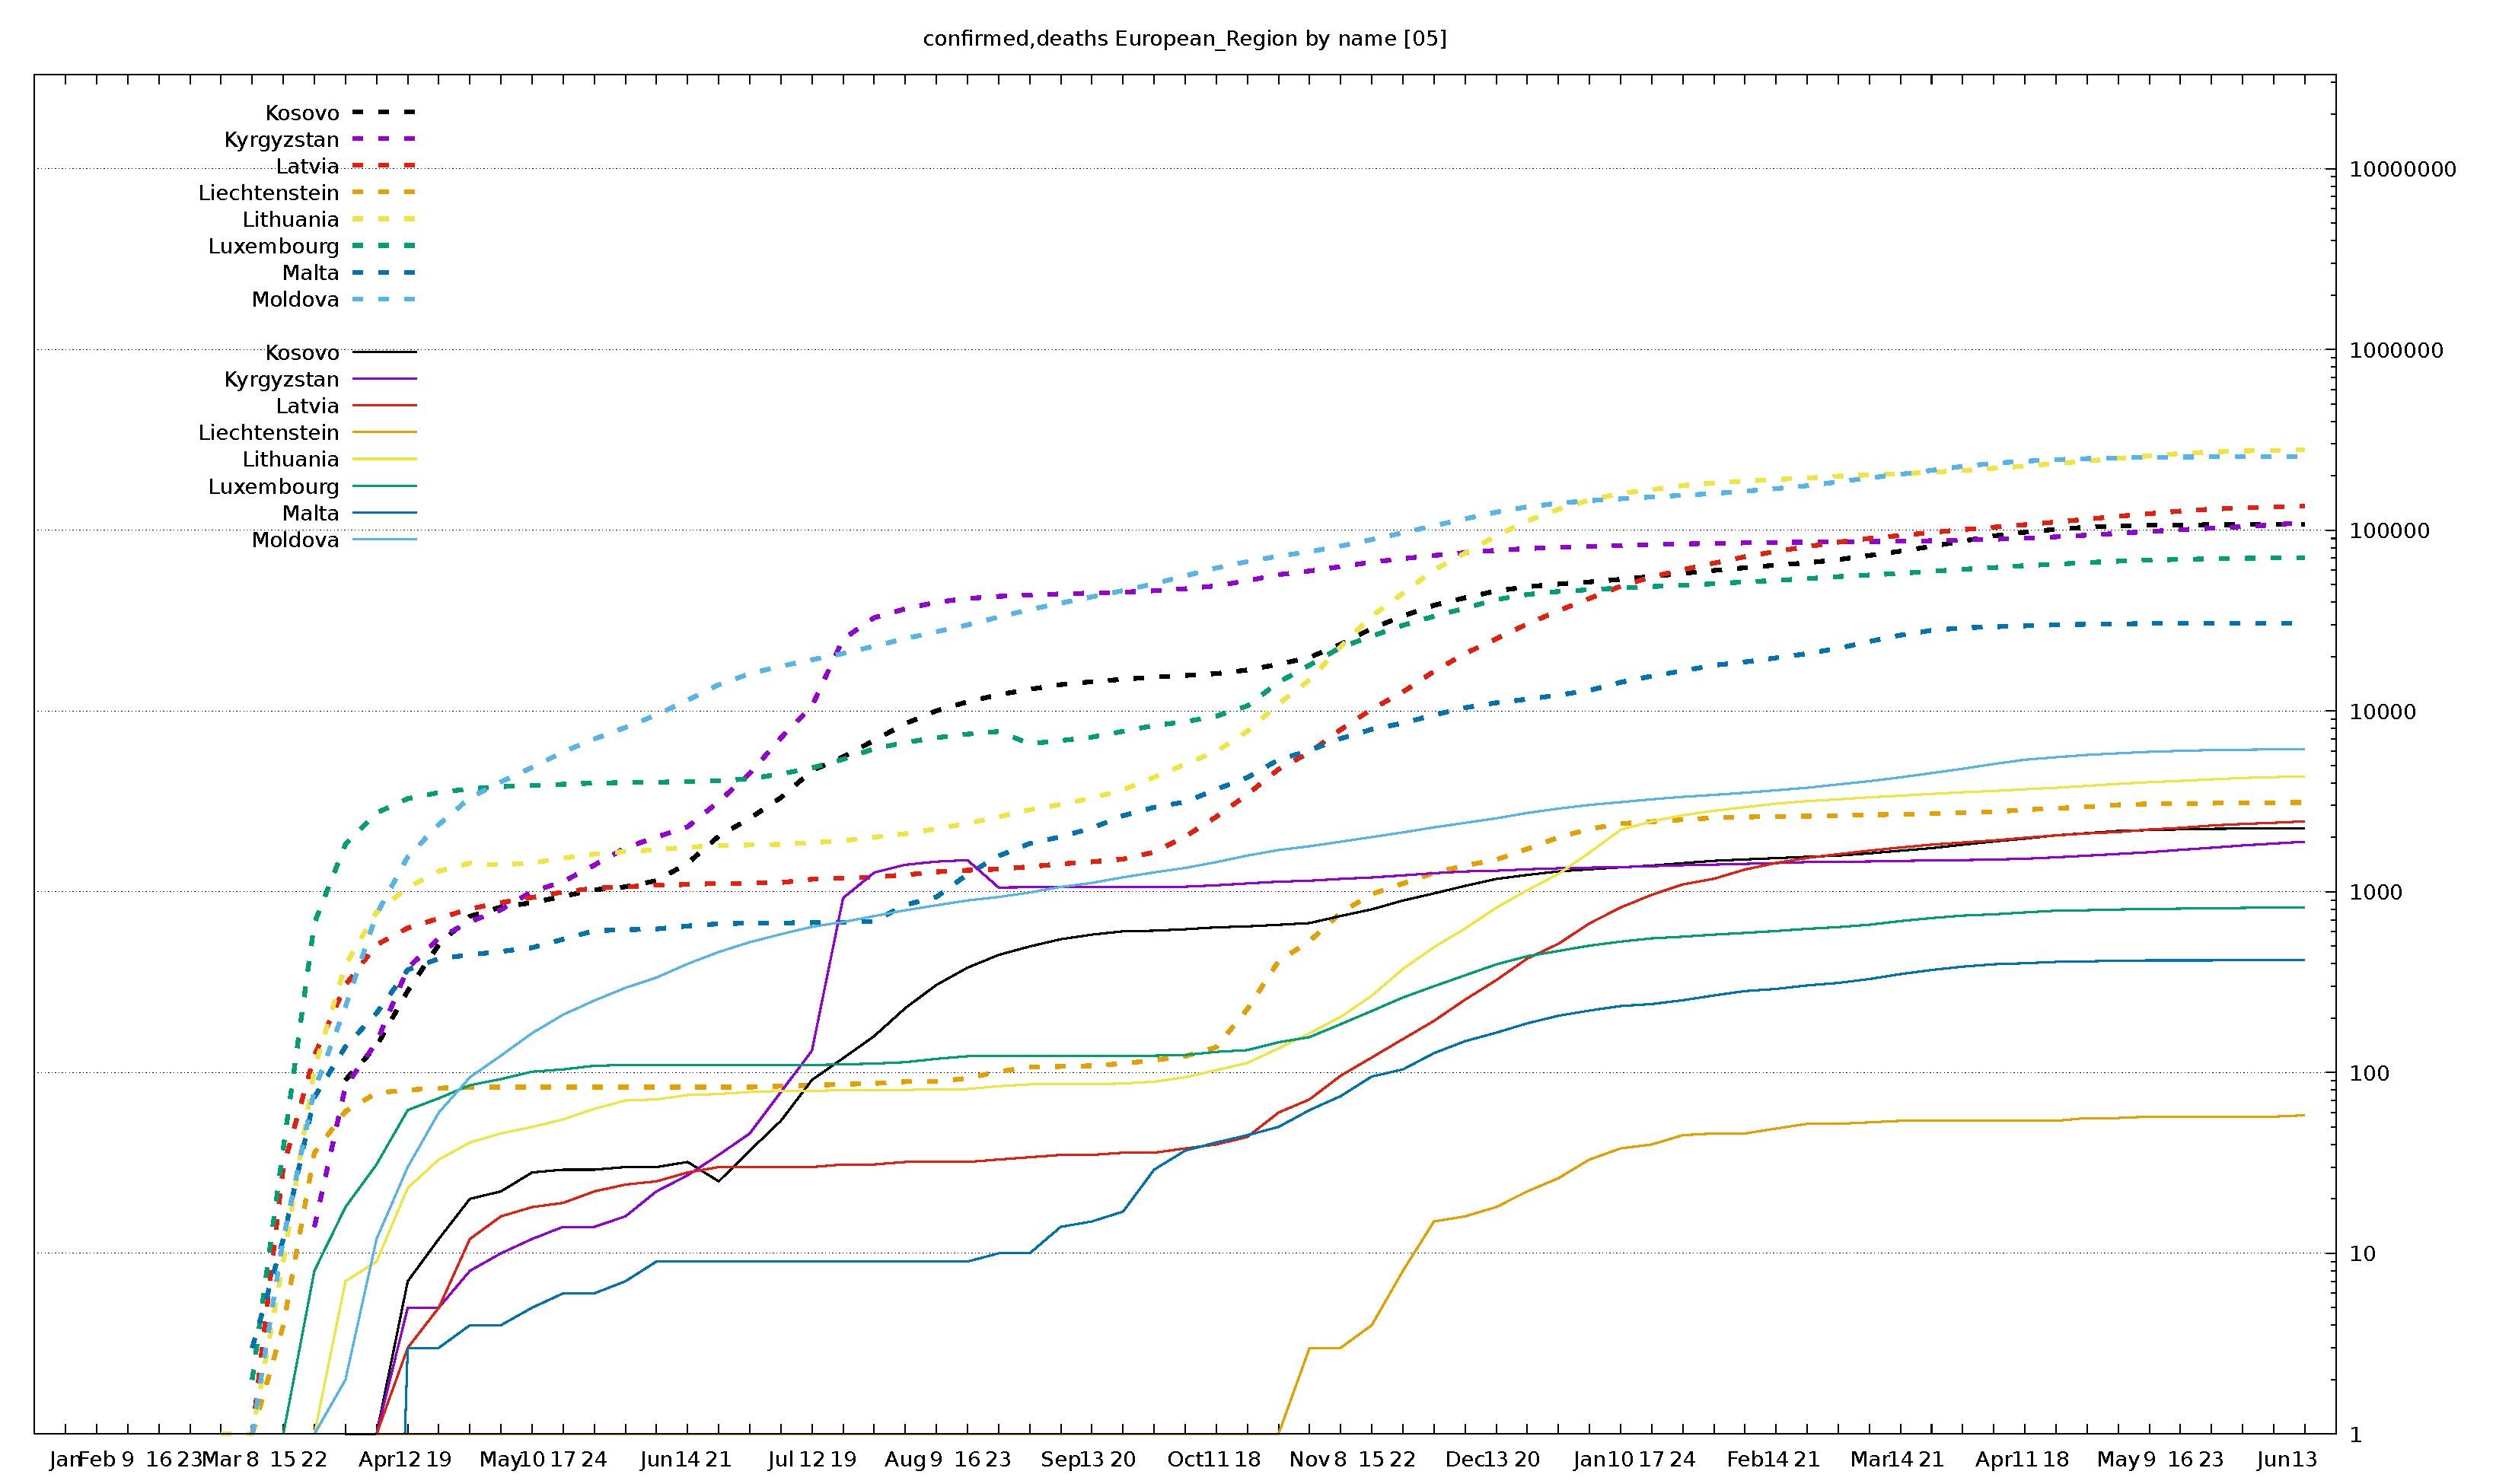
English: Visualization of "Total Confirmed Cases" (thick dashed lines) and "Total Deaths" (thin solid lines) figures from the available WHO COVID-19 situation reports. Countries are ordered alphabetically by name. The visualization is split into diagrams of 8 countries each, since gnuplot (in batch mode) does not support more distinct colors; all diagrams share the same scale. The vertical axis has logarithmic scale. The horizontal axis starts on 20 Jan 2020 (Situation Report 1) and ends on 13 Jun 2021 (Weekly Epidemiological Update 44); later WHO reports omit detailled figures.
For an overview of all related visualizations, and a more detailled description, including gnuplot source code, see WHO Covid diagram set#Available up-to-date region diagrams (weekly). |
| Date | |
| Source | Own work |
| Author | Jochen Burghardt |
Licensing
I, the copyright holder of this work, hereby publish it under the following license:
This file is licensed under the Creative Commons Attribution-Share Alike 4.0 International license.
- You are free:
- to share – to copy, distribute and transmit the work
- to remix – to adapt the work
- Under the following conditions:
- attribution – You must give appropriate credit, provide a link to the license, and indicate if changes were made. You may do so in any reasonable manner, but not in any way that suggests the licensor endorses you or your use.
- share alike – If you remix, transform, or build upon the material, you must distribute your contributions under the same or compatible license as the original.
File history
Click on a date/time to view the file as it appeared at that time.
| Date/Time | Thumbnail | Dimensions | User | Comment | |
|---|---|---|---|---|---|
| current | 09:30, 16 June 2021 |  | 3,300 × 1,950 (31 KB) | Jochen Burghardt | week 4/2020 ... 23/2021 (26 Jan 2020 ... 13 Jun 2021) |
File usage
The following page uses this file: