Davenport diagram
Davenport Diagram is a graphical representation used in the field of acid-base physiology to understand the changes in blood pH, carbon dioxide (CO2) tension, and bicarbonate (HCO3-) levels in the body. It is a vital tool for clinicians and researchers to diagnose and manage acid-base imbalances in patients. The diagram was named after American physiologist Horace W. Davenport, who made significant contributions to the understanding of gastric acid secretion and acid-base balance in the human body.
Overview[edit]
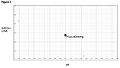
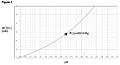
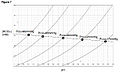
The Davenport Diagram plots the pH of blood on the x-axis against the partial pressure of carbon dioxide (PCO2) on the y-axis. Lines of constant bicarbonate concentration are drawn across these axes. This setup allows for the visualization of the relationship between blood pH, CO2, and bicarbonate levels, which are crucial components of the body's acid-base homeostasis. The diagram illustrates how changes in CO2 or bicarbonate can lead to various acid-base disorders, such as acidosis and alkalosis, both of which can be either metabolic or respiratory in origin.
Clinical Significance[edit]
The Davenport Diagram is particularly useful in clinical settings for:
- Diagnosing the type of acid-base disorder a patient may be experiencing.
- Understanding the compensatory mechanisms the body employs in response to acid-base disturbances.
- Guiding the treatment of acid-base imbalances by predicting the effects of changes in bicarbonate or CO2 levels on blood pH.
Types of Acid-Base Disorders[edit]
The diagram helps in identifying four primary types of acid-base disorders:
- Metabolic Acidosis: Characterized by a decrease in bicarbonate levels, leading to a decrease in blood pH.
- Metabolic Alkalosis: Characterized by an increase in bicarbonate levels, leading to an increase in blood pH.
- Respiratory Acidosis: Caused by an increase in CO2 levels, leading to a decrease in blood pH.
- Respiratory Alkalosis: Caused by a decrease in CO2 levels, leading to an increase in blood pH.
Interpreting the Diagram[edit]
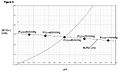
To interpret the Davenport Diagram, one must understand the concept of buffer systems in the blood, primarily the bicarbonate buffer system. The diagram shows that for a given change in CO2, there is a corresponding required change in bicarbonate to maintain a normal pH. This relationship is governed by the Henderson-Hasselbalch equation, which is a cornerstone of acid-base physiology.
Limitations[edit]
While the Davenport Diagram is a powerful tool for understanding acid-base balance, it has limitations. It assumes that the body's temperature and the levels of other ions (such as potassium and chloride) are normal, which may not always be the case in clinical scenarios. Additionally, it does not account for the role of the kidneys and lungs in long-term pH regulation.
Conclusion[edit]
The Davenport Diagram remains an essential tool in the field of medicine for diagnosing and managing acid-base imbalances. Its ability to visually represent the complex interactions between pH, CO2, and bicarbonate levels makes it invaluable for clinicians and researchers alike.

-
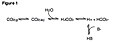 Important acid-base reactions involving carbon dioxide
 -
 Davenport diagram
 -
 Davenport diagram
 -
 Davenport diagram
 -
 Davenport diagram
 -
 Davenport diagram
 -
 Davenport diagram
 -
 Davenport diagram
 -
 Davenport diagram
 -
 Davenport diagram
 -
 Davenport diagram
 -
 Davenport diagram


Ad. Transform your health with W8MD Weight Loss, Sleep & MedSpa

Tired of being overweight?
Special offer:
Budget GLP-1 weight loss medications
- Semaglutide starting from $29.99/week and up with insurance for visit of $59.99 and up per week self pay.
- Tirzepatide starting from $45.00/week and up (dose dependent) or $69.99/week and up self pay
✔ Same-week appointments, evenings & weekends
Learn more:
- GLP-1 weight loss clinic NYC
- W8MD's NYC medical weight loss
- W8MD Philadelphia GLP-1 shots
- Philadelphia GLP-1 injections
- Affordable GLP-1 shots NYC
|
WikiMD Medical Encyclopedia |
Medical Disclaimer: WikiMD is for informational purposes only and is not a substitute for professional medical advice. Content may be inaccurate or outdated and should not be used for diagnosis or treatment. Always consult your healthcare provider for medical decisions. Verify information with trusted sources such as CDC.gov and NIH.gov. By using this site, you agree that WikiMD is not liable for any outcomes related to its content. See full disclaimer.
Credits:Most images are courtesy of Wikimedia commons, and templates, categories Wikipedia, licensed under CC BY SA or similar.
Translate this page: - East Asian
中文,
日本,
한국어,
South Asian
हिन्दी,
தமிழ்,
తెలుగు,
Urdu,
ಕನ್ನಡ,
Southeast Asian
Indonesian,
Vietnamese,
Thai,
မြန်မာဘာသာ,
বাংলা
European
español,
Deutsch,
français,
Greek,
português do Brasil,
polski,
română,
русский,
Nederlands,
norsk,
svenska,
suomi,
Italian
Middle Eastern & African
عربى,
Turkish,
Persian,
Hebrew,
Afrikaans,
isiZulu,
Kiswahili,
Other
Bulgarian,
Hungarian,
Czech,
Swedish,
മലയാളം,
मराठी,
ਪੰਜਾਬੀ,
ગુજરાતી,
Portuguese,
Ukrainian
