Pearson correlation coefficient: Difference between revisions
CSV import Tags: mobile edit mobile web edit |
CSV import |
||
| Line 41: | Line 41: | ||
{{Statistics-stub}} | {{Statistics-stub}} | ||
<gallery> | |||
File:Correlation_coefficient.png|Pearson correlation coefficient | |||
File:Correlation_examples2.svg|Examples of correlation | |||
File:Regression_lines.png|Regression lines | |||
File:Pearson_correlation_and_prediction_intervals.svg|Pearson correlation and prediction intervals | |||
File:Critical_correlation_vs._sample_size.svg|Critical correlation vs. sample size | |||
</gallery> | |||
Latest revision as of 04:57, 18 February 2025
Pearson correlation coefficient, also known as Pearson's r, is a measure of the strength and direction of association that exists between two continuous variables. It is a method of correlation: a statistical technique used to determine the degree to which two variables are related. The coefficient values range from -1 to 1, where -1 indicates a perfect negative linear relationship, 0 indicates no linear relationship, and 1 indicates a perfect positive linear relationship.
Definition[edit]
The Pearson correlation coefficient is defined as the covariance of the two variables divided by the product of their standard deviations. Mathematically, it is represented as:
\[ r = \frac{n(\sum xy) - (\sum x)(\sum y)}{\sqrt{[n\sum x^2 - (\sum x)^2][n\sum y^2 - (\sum y)^2]}} \]
where:
- \(n\) is the number of data points,
- \(x\) and \(y\) are the variables,
- \(\sum\) denotes the summation.
Interpretation[edit]
The value of the Pearson correlation coefficient indicates the strength and direction of the linear relationship between two variables. A value close to 1 implies a strong positive relationship, a value close to -1 implies a strong negative relationship, and a value around 0 implies no linear relationship.
Assumptions[edit]
The calculation and interpretation of Pearson's r assume that:
- Both variables are normally distributed.
- The relationship between the variables is linear.
- The data is homoscedastic, meaning the variance within each variable is the same.
Applications[edit]
Pearson's r is widely used in the fields of statistics, psychology, medicine, and social sciences to measure the linear relationship between variables. It is particularly useful in research studies that aim to determine the strength and direction of relationships among continuous variables.
Limitations[edit]
While Pearson's r is a powerful tool for measuring linear relationships, it has limitations:
- It can only measure linear relationships and may not accurately represent non-linear relationships.
- It is sensitive to outliers, which can significantly affect the coefficient value.
- It assumes that the relationship between variables is linear and may not accurately reflect the complexity of real-world data.
See also[edit]
References[edit]
<references/>

This article is a statistics-related stub. You can help WikiMD by expanding it!
-
 Pearson correlation coefficient
 -
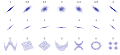 Examples of correlation
 -
 Regression lines
 -
 Pearson correlation and prediction intervals
 -
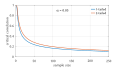 Critical correlation vs. sample size


