Partial autocorrelation function: Difference between revisions
CSV import |
CSV import |
||
| Line 34: | Line 34: | ||
{{Statistics-stub}} | {{Statistics-stub}} | ||
<gallery> | |||
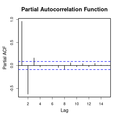
File:Partial_autocorrelation_function.png|Partial autocorrelation function | |||
File:Partial_Autocorrelation_Function_Graph.png|Partial autocorrelation function graph | |||
</gallery> | |||
Latest revision as of 01:30, 18 February 2025
Partial Autocorrelation Function (PACF) is a statistical tool used in the analysis of time series data. It measures the extent of association between a variable and its lag, controlling for the effects of previous lags. This concept is crucial in the fields of Time Series Analysis, Econometrics, and Signal Processing, among others, where understanding the internal dynamics of a series is essential for forecasting and model building.
Definition[edit]
The Partial Autocorrelation Function of a time series is the correlation between observations at two points in time, adjusted for the correlations at all shorter lags. Mathematically, if we consider a time series \(Y_t\), the PACF at lag \(k\), denoted as \(\alpha(k)\), is the correlation between \(Y_t\) and \(Y_{t-k}\) after removing the effect of the intervening lags \(1\) to \(k-1\).
Calculation[edit]
The calculation of PACF for a given lag \(k\) involves fitting two autoregressive models: one of order \(k\) and the other of order \(k-1\). The coefficient of the \(k^{th}\) lag in the order \(k\) model represents the partial autocorrelation at lag \(k\). Various algorithms, such as the Durbin-Levinson algorithm, are used for efficient computation of PACF values.
Applications[edit]
PACF is widely used in the analysis and modeling of time series data. Some of its applications include:
- Model Identification: In Autoregressive Integrated Moving Average (ARIMA) modeling, PACF is used to identify the order of the autoregressive (AR) part of the model.
- Signal Analysis: In signal processing, PACF helps in identifying the underlying structure of the signal, which is useful in noise reduction and signal forecasting.
- Economic Forecasting: Economists use PACF to analyze economic data such as GDP, inflation rates, and stock prices for predictive modeling.
Interpretation[edit]
The interpretation of PACF plots can provide insights into the data's structure. A sharp cut-off in the PACF plot after lag \(p\) suggests an AR(p) model might be appropriate for the data. Conversely, a gradual decline suggests a different model might be more suitable.
Limitations[edit]
While PACF is a powerful tool, it has limitations. It assumes linearity and stationarity of the time series, which may not always be the case. Additionally, the interpretation of PACF values can be subjective and requires expertise.
See Also[edit]
- Autocorrelation Function (ACF)
- Time Series Decomposition
- Box-Jenkins Methodology
- Durbin-Watson Statistic
References[edit]
<references/>

This article is a statistics-related stub. You can help WikiMD by expanding it!
-
 Partial autocorrelation function
 -
 Partial autocorrelation function graph


