Multilevel model: Difference between revisions
CSV import |
CSV import |
||
| Line 38: | Line 38: | ||
{{Statistics-stub}} | {{Statistics-stub}} | ||
<gallery> | |||
File:Linearity_Graphs.jpg|Linearity Graphs | |||
File:Statistical_Power_Model.jpg|Statistical Power Model | |||
File:Bayesian_research_cycle.png|Bayesian Research Cycle | |||
</gallery> | |||
Latest revision as of 01:05, 18 February 2025
Multilevel models (also known as hierarchical linear models, nested data models, or mixed models) are statistical models of parameters that vary at more than one level. These models are particularly useful in the analysis of data structures that involve multiple levels of organization, where the lower-level units are nested within higher-level units. For example, in the field of education, students (lower-level units) are nested within classrooms (higher-level units), which in turn are nested within schools. Multilevel models allow researchers to address research questions that involve data with such hierarchical structures.
Overview[edit]
Multilevel models recognize that data collected in many scientific disciplines are organized at more than one level and that these levels may influence the data's structure and analysis. The key feature of multilevel models is their ability to partition the total variance in the outcome into variance components associated with each level of the hierarchical structure. This approach allows for more accurate inferences about the effects at each level, taking into account the potential correlation of observations within the same group (e.g., students within the same school).
Applications[edit]
Multilevel models are widely used across various fields such as education, psychology, public health, sociology, and economics. In education, they can be used to study the effectiveness of teaching methods across different schools. In public health, they might analyze the impact of community-level interventions on individual health outcomes. These models are particularly valuable in longitudinal studies where the interest lies in understanding changes over time within individuals and groups.
Model Formulation[edit]
A basic two-level model can be formulated as follows:
Level 1 (within-group): \[ Y_{ij} = \beta_{0j} + \beta_{1j}X_{ij} + \epsilon_{ij} \]
Level 2 (between-group): \[ \beta_{0j} = \gamma_{00} + \gamma_{01}W_{j} + u_{0j} \] \[ \beta_{1j} = \gamma_{10} + \gamma_{11}W_{j} + u_{1j} \]
Where \(Y_{ij}\) is the outcome for individual \(i\) in group \(j\), \(X_{ij}\) is a predictor variable for individual \(i\) in group \(j\), \(W_{j}\) is a predictor variable for group \(j\), \(\beta_{0j}\) and \(\beta_{1j}\) are the intercept and slope for group \(j\), respectively, and \(\epsilon_{ij}\), \(u_{0j}\), and \(u_{1j}\) are error terms.
Advantages and Challenges[edit]
The primary advantage of multilevel models is their flexibility in handling data with complex hierarchical structures and their ability to provide more accurate estimates by considering the dependency of observations within groups. However, these models also present challenges, including the need for sophisticated statistical software, the complexity of model specification and interpretation, and the requirement for larger sample sizes to achieve sufficient statistical power.
Software[edit]
Several statistical software packages support multilevel modeling, including R, SAS, SPSS, and Stata. Each offers various procedures and functions for fitting multilevel models, with differences in syntax, capabilities, and output.
See Also[edit]
- Linear regression
- Generalized linear model
- Fixed effects model
- Random effects model
- Longitudinal study

This article is a statistics-related stub. You can help WikiMD by expanding it!
-
 Linearity Graphs
 -
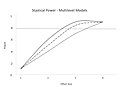 Statistical Power Model
 -
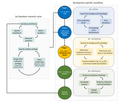 Bayesian Research Cycle


