File:U.S. economic recovery scorecard.png
From WikiMD's medical encyclopedia
Size of this preview: 800 × 451 pixels. Other resolutions: 320 × 180 pixels | 640 × 360 pixels | 1,024 × 577 pixels | 1,408 × 793 pixels.
Original file (1,408 × 793 pixels, file size: 183 KB, MIME type: image/png)
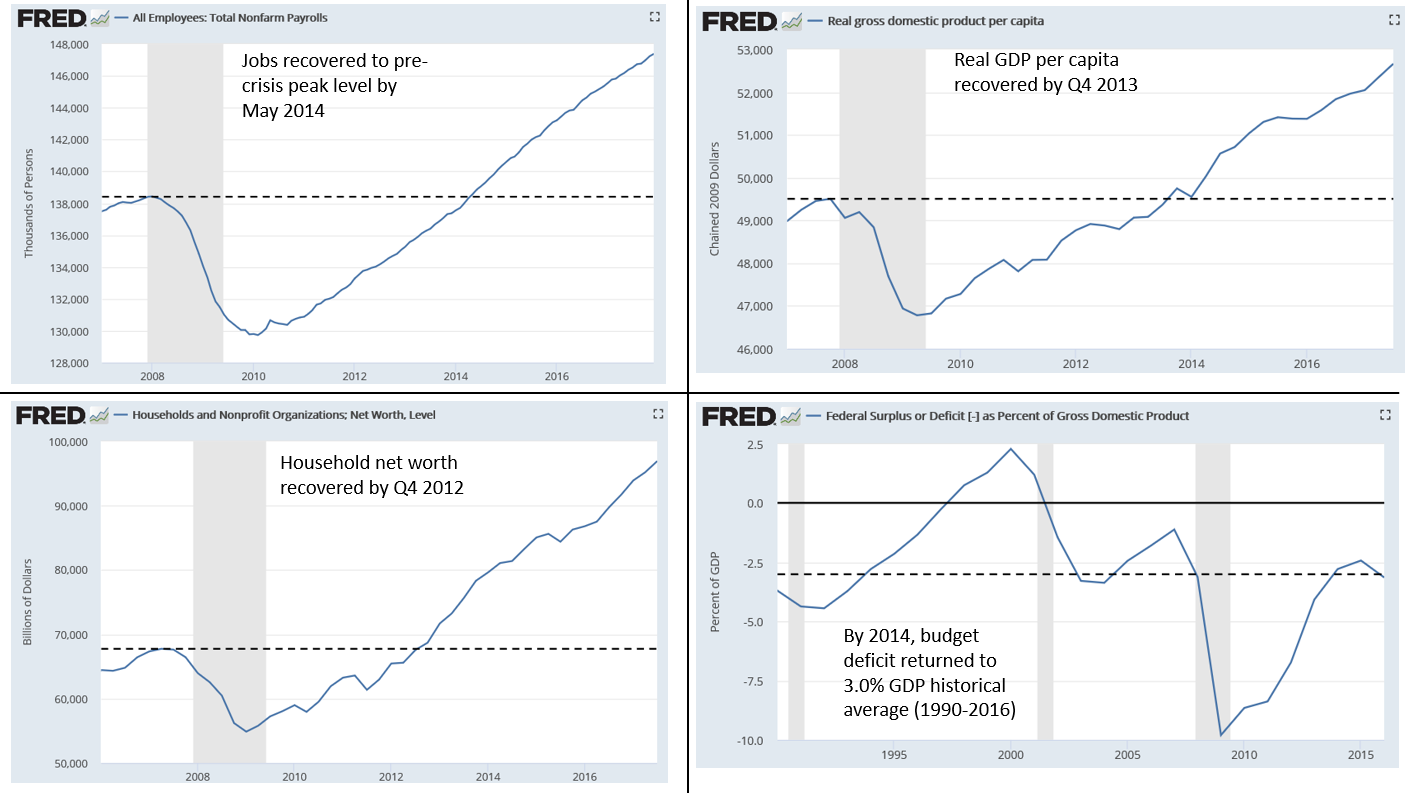
Understanding the chart
The graphic contains several economic data series from the Federal Reserve Economic Data (FRED) along with a dotted line indicating the pre-crisis level or historical average.
- Non-farm payroll jobs[1]
- Real GDP per capita[2]
- Household net worth[3]
- Federal budget deficit as % GDP[4]
References
Summary
| Description |
English: Several major U.S. economic variables had recovered from the 2007-2009 Great Recession by the 2013-2014 time period. |
| Date | |
| Source |
Own work, using FRED
|
| Author | Farcaster |
Licensing
| This chart is ineligible for copyright and therefore in the public domain, because it consists entirely of information that is common property and contains no original authorship. For more information, see Commons:Threshold of originality § Charts
|
File history
Click on a date/time to view the file as it appeared at that time.
| Date/Time | Thumbnail | Dimensions | User | Comment | |
|---|---|---|---|---|---|
| current | 20:19, 22 January 2018 | | 1,408 × 793 (183 KB) | Farcaster | User created page with UploadWizard |
File usage
The following page uses this file: