File:Trends in Christmas Movies over nearly a Century (1925-2022).svg
From WikiMD's medical encyclopedia

Size of this PNG preview of this SVG file: 800 × 566 pixels. Other resolutions: 320 × 226 pixels | 640 × 452 pixels | 1,024 × 724 pixels | 1,280 × 905 pixels | 2,560 × 1,810 pixels | 1,191 × 842 pixels.
Original file (SVG file, nominally 1,191 × 842 pixels, file size: 382 KB)
.svg)
Summary
| Description |
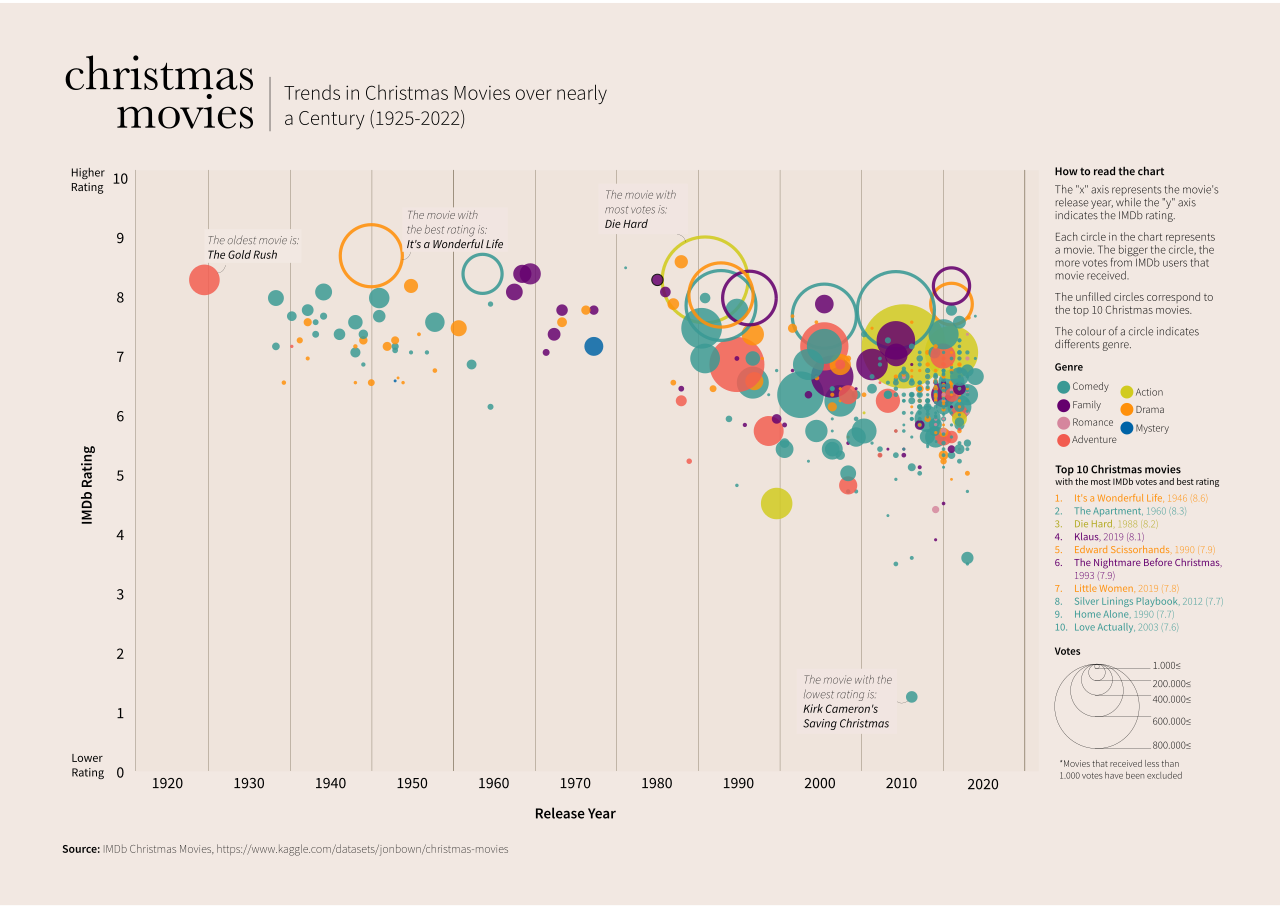
English: The image shows a bubble chart illustrating been trending in Christmas movies over a period of years, from 1925 to 2022.
In this chart, the "x" axis represents the movie's release year, while the "y" axis indicates the IMDb rating, ranging from the lowest, which is 0, to the highest, which is 10. Each circle represents a movie (a total of 444 movies were considered). The bigger the circle, the more IMDb user votes that movie received. Only movies with more than 1,000 votes were included in the list. The unfilled circles correspond to the top 10 Christmas movies. Each color represents a genre. Original graphs made using Rawgraphs, later edited by own user in Illustrator. Data Source: IMDb Christmas Movies, https://www.kaggle.com/datasets/jonbown/christmas-movies |
| Date | |
| Source | IMDb Christmas Movies |
| Author | Javidlm |
Licensing
I, the copyright holder of this work, hereby publish it under the following license:
This file is licensed under the Creative Commons Attribution-Share Alike 4.0 International license.
- You are free:
- to share – to copy, distribute and transmit the work
- to remix – to adapt the work
- Under the following conditions:
- attribution – You must give appropriate credit, provide a link to the license, and indicate if changes were made. You may do so in any reasonable manner, but not in any way that suggests the licensor endorses you or your use.
- share alike – If you remix, transform, or build upon the material, you must distribute your contributions under the same or compatible license as the original.
File history
Click on a date/time to view the file as it appeared at that time.
| Date/Time | Thumbnail | Dimensions | User | Comment | |
|---|---|---|---|---|---|
| current | 15:28, 5 October 2023 | | 1,191 × 842 (382 KB) | Javidlm | - |
File usage
The following page uses this file:
.svg)
.svg&mobileaction=toggle_view_mobile)