File:Poverty rates by state. US map.svg
From WikiMD's medical encyclopedia

Size of this PNG preview of this SVG file: 512 × 341 pixels. Other resolutions: 320 × 213 pixels | 640 × 426 pixels | 800 × 533 pixels | 1,024 × 682 pixels | 1,280 × 853 pixels | 2,560 × 1,705 pixels.
Original file (SVG file, nominally 512 × 341 pixels, file size: 53 KB)
This image should always reflect the most recent version. Feel free to update it when needed.
|
Summary
| Description |
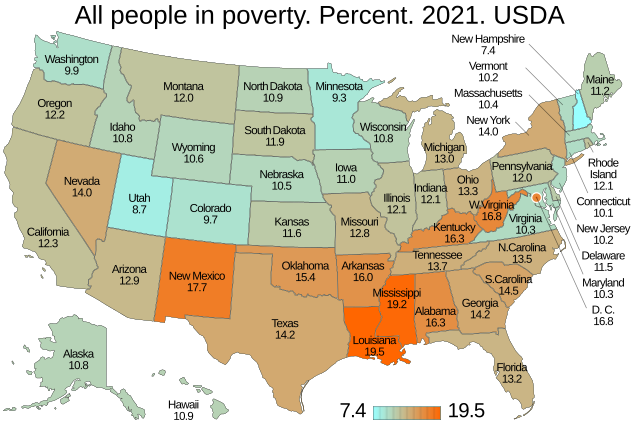
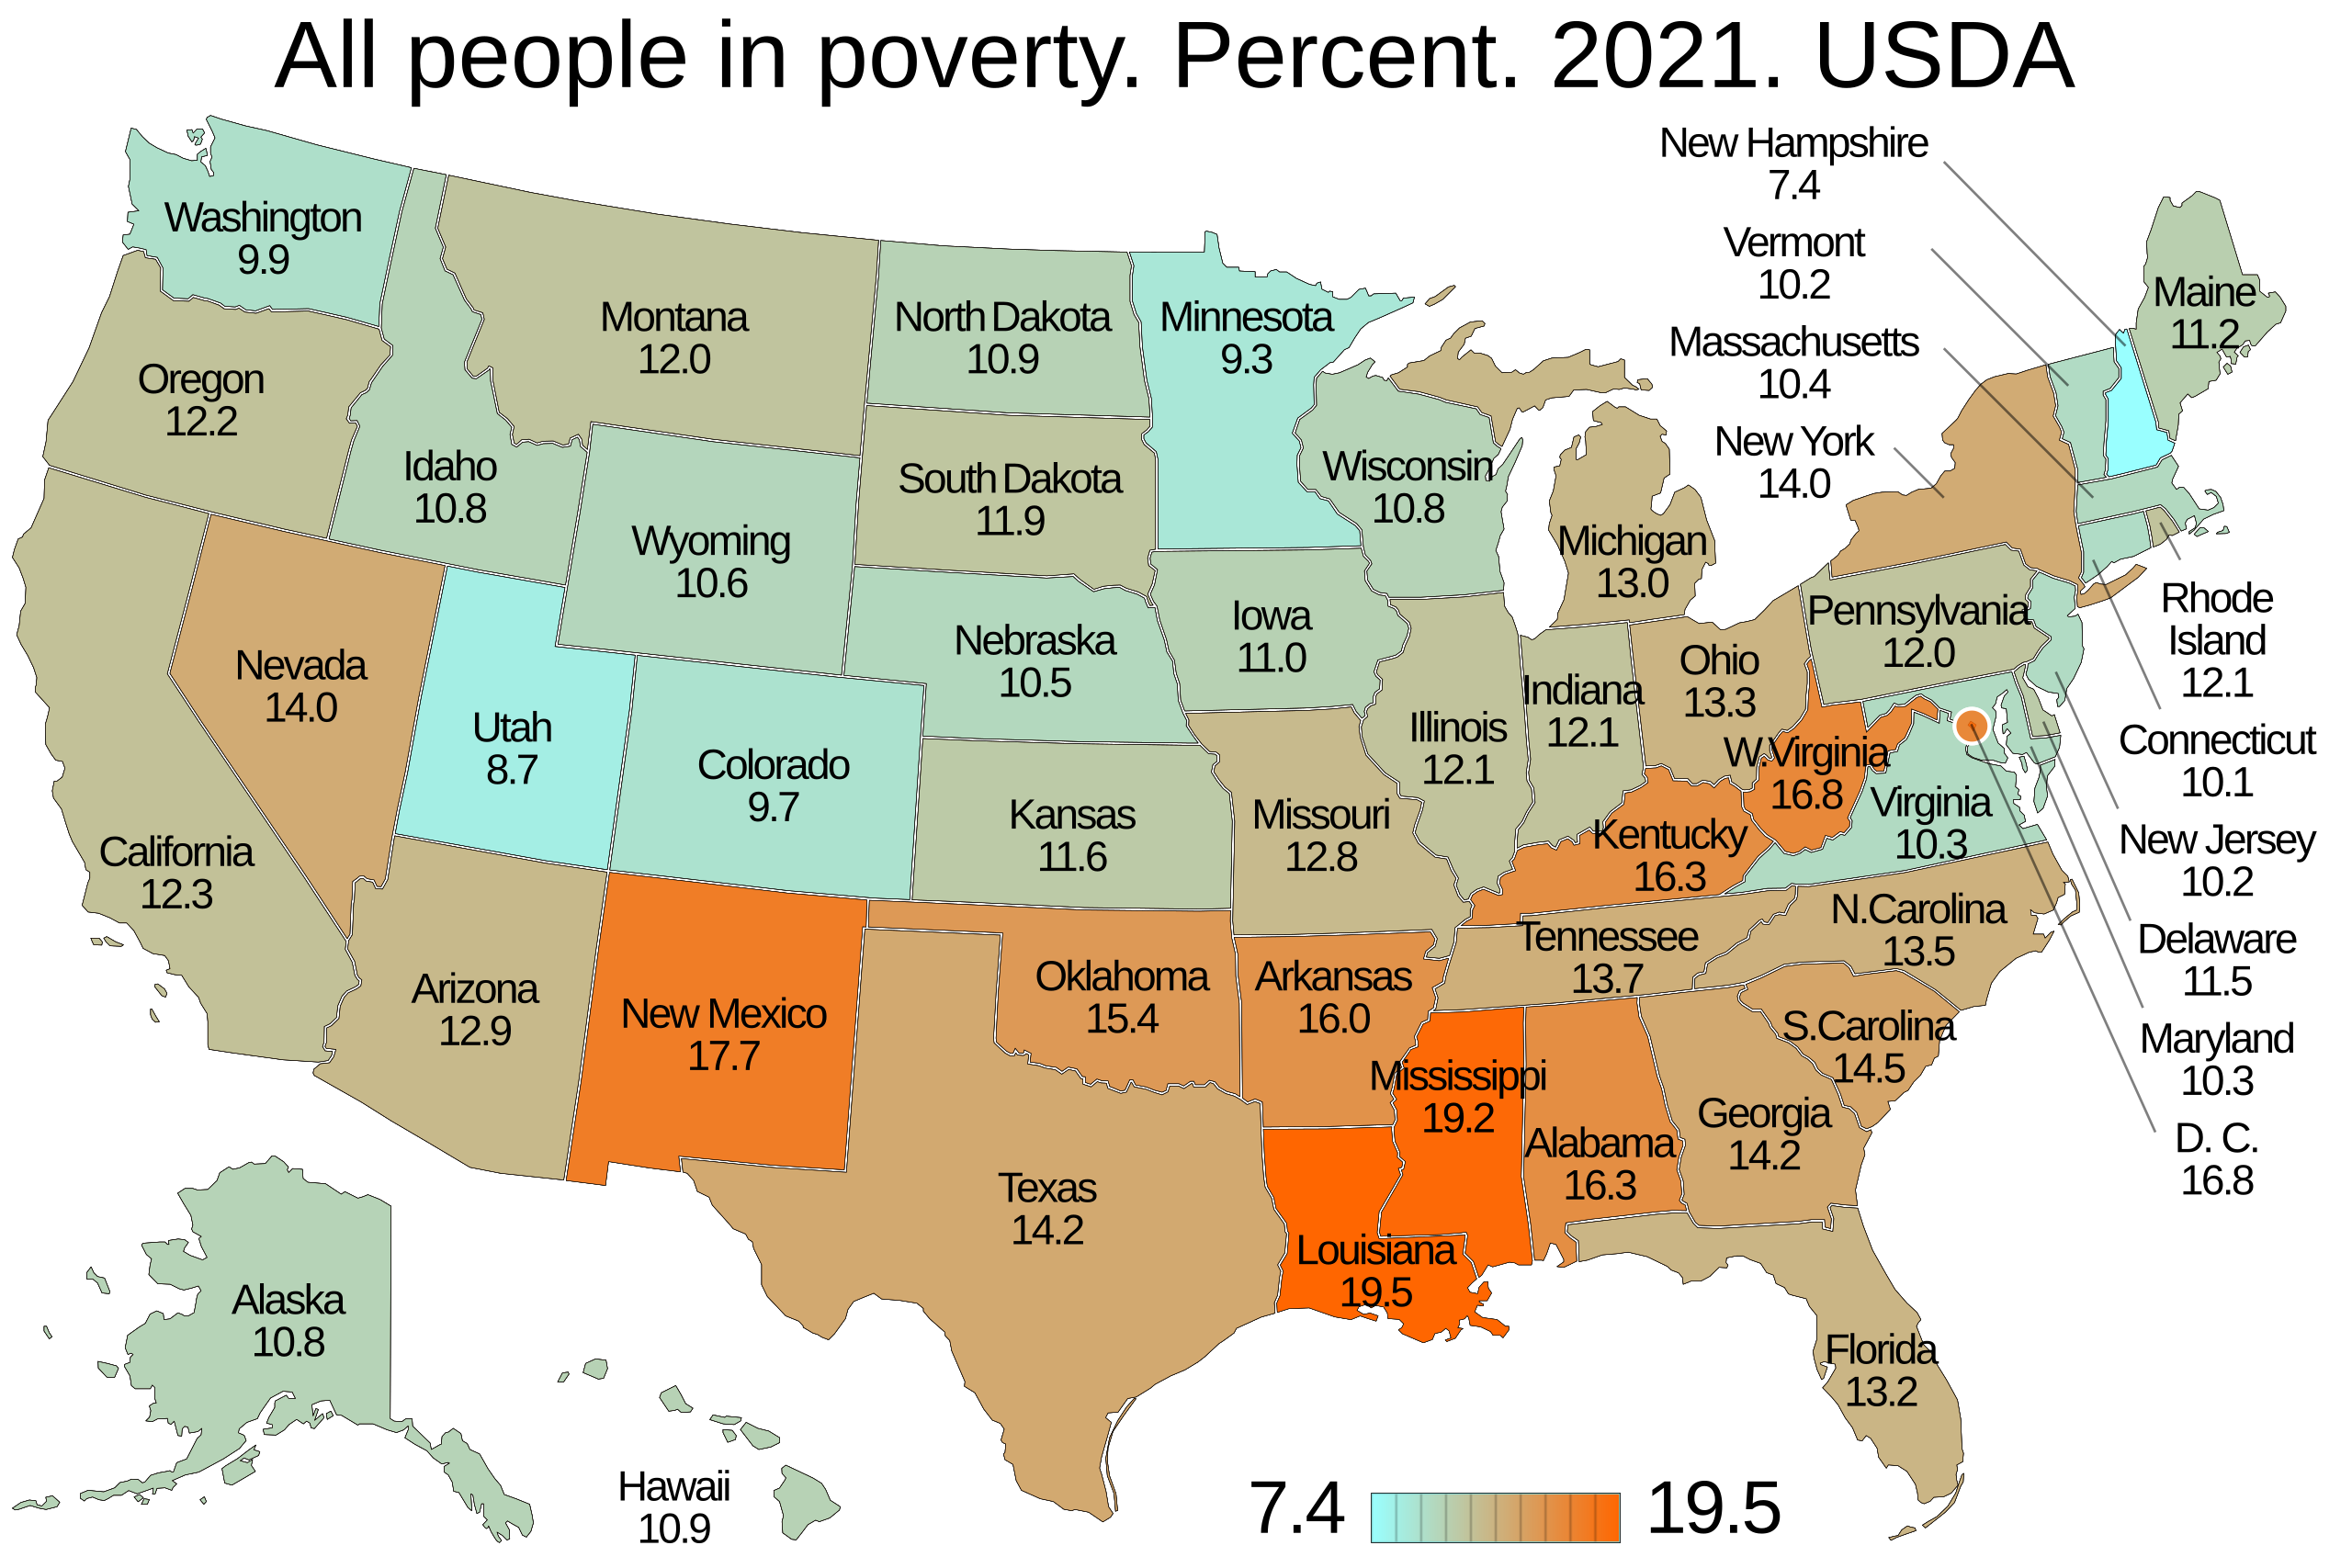
English: Map of poverty rates by US state. 2023. United States Census Bureau. |
| Date | - date of first upload to the Commons. See file history for latest upload date. |
| Source | Data source: Poverty in States and Metropolitan Areas: 2023. American Community Survey Briefs. By Craig Benson. ACSBR-022. September 2024. U.S. Census Bureau. Appendix Table 1 on page 11. "Source: U.S. Census Bureau, 2022 and 2023 American Community Survey, 1-year estimates, and 2022 and 2023 Puerto Rico Community Survey." |
| Author | User:Timeshifter from template: File:Template map of US states and District of Columbia.svg |
Licensing
| This map is ineligible for copyright and therefore in the public domain, because it consists entirely of information that is common property and contains no original authorship. For more information, see Commons:Threshold of originality § Maps.
|
Data table for map
Copy and paste, as is, into the template.
50 states plus Washington D.C.
| Area | Percent |
|---|---|
| Alabama | 15.6 |
| Alaska | 10.4 |
| Arizona | 12.4 |
| Arkansas | 15.7 |
| California | 12.0 |
| Colorado | 9.3 |
| Connecticut | 10.3 |
| Delaware | 10.5 |
| Florida | 12.3 |
| Georgia | 13.6 |
| Hawaii | 10.1 |
| Idaho | 10.1 |
| Illinois | 11.6 |
| Indiana | 12.3 |
| Iowa | 11.3 |
| Kansas | 11.2 |
| Kentucky | 16.4 |
| Louisiana | 18.9 |
| Maine | 10.4 |
| Maryland | 9.5 |
| Massachusetts | 10.4 |
| Michigan | 13.5 |
| Minnesota | 9.3 |
| Mississippi | 18.0 |
| Missouri | 12.0 |
| Montana | 11.7 |
| Nebraska | 10.5 |
| Nevada | 12.0 |
| New Hampshire | 7.2 |
| New Jersey | 9.7 |
| New Mexico | 17.8 |
| New York | 14.2 |
| North Carolina | 12.8 |
| North Dakota | 9.8 |
| Ohio | 13.3 |
| Oklahoma | 15.9 |
| Oregon | 12.2 |
| Pennsylvania | 12.0 |
| Rhode Island | 10.8 |
| South Carolina | 13.9 |
| South Dakota | 11.8 |
| Tennessee | 14.0 |
| Texas | 13.7 |
| Utah | 9.0 |
| Vermont | 9.7 |
| Virginia | 10.2 |
| Washington | 10.3 |
| Washington, D.C. | 14.0 |
| West Virginia | 16.7 |
| Wisconsin | 10.7 |
| Wyoming | 11.3 |
File history
Click on a date/time to view the file as it appeared at that time.
| Date/Time | Thumbnail | Dimensions | User | Comment | |
|---|---|---|---|---|---|
| current | 21:59, 22 May 2025 | | 512 × 341 (53 KB) | Timeshifter | 2023 |
File usage
The following page uses this file: