File:Percentile interpolation.png
From WikiMD's medical encyclopedia

Size of this preview: 800 × 533 pixels. Other resolutions: 320 × 213 pixels | 640 × 427 pixels | 1,024 × 683 pixels | 1,280 × 853 pixels | 2,400 × 1,600 pixels.
Original file (2,400 × 1,600 pixels, file size: 198 KB, MIME type: image/png)
Summary
| Description |
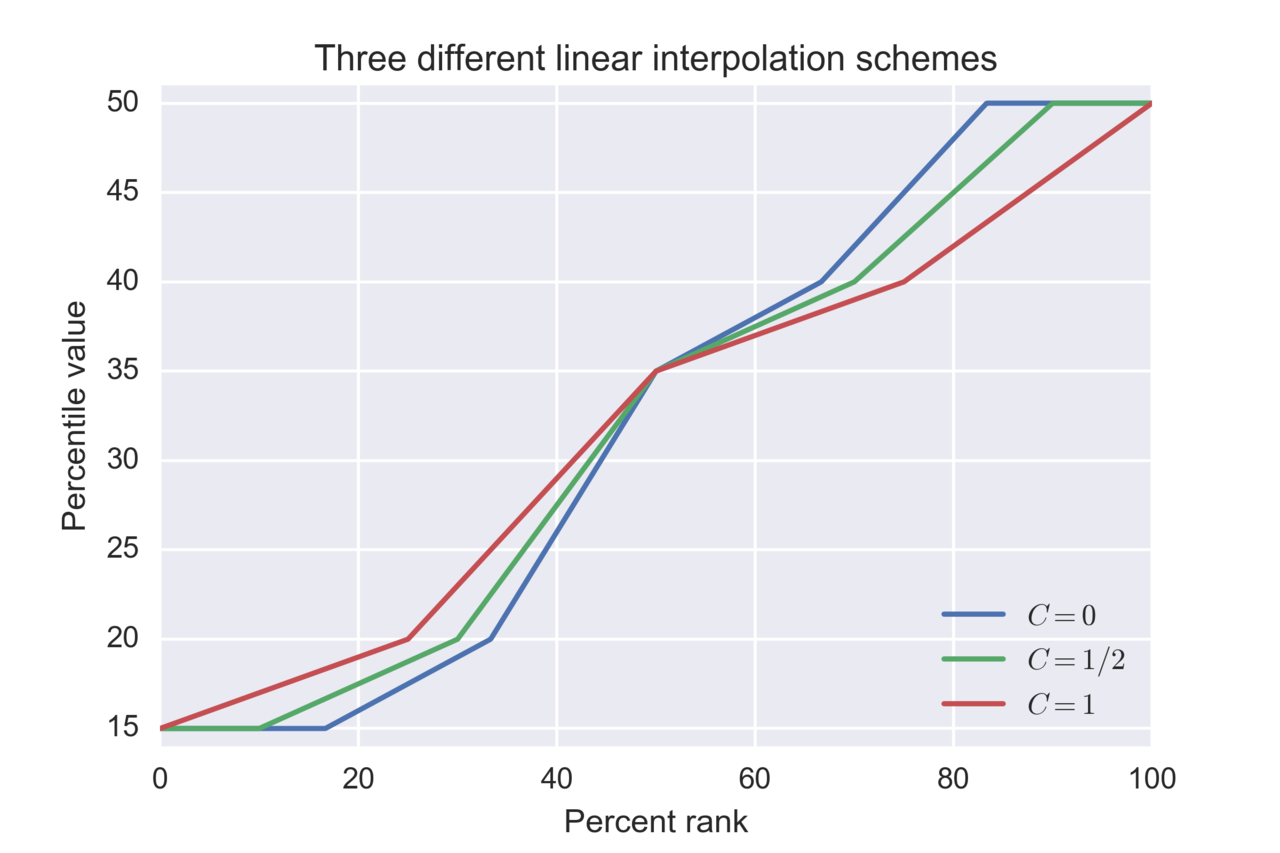
English: The different interpolation schemes for calculation of percentiles, as outlined in en:Percentile. |
| Date | |
| Source | Own work |
| Author | Pred |
Source code
The plot may be reproduced using the following Python code:
import matplotlib.pyplot as plt
import numpy as np
import seaborn as sns

def fractile(l, p, C):
    """Find the p'th fractile of l for various interpolation schemes.
    All schemes are linear but vary in their definition of the range
    of the CDF.

    Args:
        l (numpy.array): The array of numbers to find fractiles for.
        p (numpy.array): The fractiles of interest (as floats between 0 and 1).
        C (float): Interpolation scheme, given as a float between 0 and 1.
            0 corresponds to what Excel's PERCENTILE.EXC calculates.
            1/2 corresponds to what MATLAB does.
            1 corresponds to what NumPy/Excel's PERCENTILE.INC calculates."""
    def get_index(N, p, C):
        the_index = (N + 1 - 2*C)*p + C - 1
        return the_index.clip(0, N-1)
    s = np.sort(l)
    x = get_index(len(s), p, C)
    s = np.append(s, 0)  # For C < 1, we add a dummy value to s to take care of the case x = N-1.

    return s[np.int_(x)]*(1-x%1) + s[np.int_(x)+1]*(x%1)

x = np.array([15, 20, 35, 40, 50])
p = np.arange(0, 100.1, 0.1)

for v in (0, 0.5, 1):
    plt.plot(p, fractile(x, p/100, v))

plt.title('Three different linear interpolation schemes')
plt.xlabel('Percent rank')
plt.ylabel('Percentile value')
plt.xlim(0, 100)
plt.ylim(14, 51)
plt.legend(['$C = 0$', '$C = 1/2$', '$C = 1$'], loc='lower right')
plt.savefig('percentile_interpolation.png', dpi=400)
Licensing
I, the copyright holder of this work, hereby publish it under the following license:
| This file is made available under the Creative Commons CC0 1.0 Universal Public Domain Dedication. | |
| The person who associated a work with this deed has dedicated the work to the public domain by waiving all of their rights to the work worldwide under copyright law, including all related and neighboring rights, to the extent allowed by law. You can copy, modify, distribute and perform the work, even for commercial purposes, all without asking permission.
|
File history
Click on a date/time to view the file as it appeared at that time.
| Date/Time | Thumbnail | Dimensions | User | Comment | |
|---|---|---|---|---|---|
| current | 13:08, 19 March 2017 | | 2,400 × 1,600 (198 KB) | Pred | User created page with UploadWizard |
File usage
The following page uses this file: