Standard deviation: Difference between revisions
CSV import Tags: mobile edit mobile web edit |
CSV import |
||
| Line 30: | Line 30: | ||
{{stub}} | {{stub}} | ||
<gallery> | |||
File:Standard_deviation_diagram.svg|Standard deviation diagram | |||
File:Normal-distribution-cumulative-density-function.svg|Normal distribution cumulative density function | |||
File:Comparison_standard_deviations.svg|Comparison of standard deviations | |||
File:Standard_deviation_diagram.svg|Standard deviation diagram | |||
File:Confidence_interval_by_Standard_deviation.svg|Confidence interval by standard deviation | |||
File:Standard_deviation_by_Confidence_interval.svg|Standard deviation by confidence interval | |||
File:MultivariateNormal.png|Multivariate normal distribution | |||
</gallery> | |||
Latest revision as of 11:35, 18 February 2025
Standard Deviation is a statistical measure that quantifies the amount of variation or dispersion of a set of values. A low standard deviation indicates that the values tend to be close to the mean (also called the expected value) of the set, while a high standard deviation indicates that the values are spread out over a wider range.
Definition[edit]
The standard deviation of a random variable, statistical population, data set, or probability distribution is the square root of its variance. It is algebraically simpler, though in practice less robust, than the average absolute deviation. A useful property of the standard deviation is that, unlike the variance, it is expressed in the same units as the data.
Calculation[edit]
In calculating the standard deviation, the differences between each of the data points and the mean are found, and squared. The squared differences are then averaged, and the square root of this average is the standard deviation.
Interpretation[edit]
The standard deviation is often used in scientific and industrial applications to express the margin of error or uncertainty in a reported measurement or result.
See Also[edit]
References[edit]
<references />
 | |
|---|---|
|
|
 |
-
 Standard deviation diagram
 -
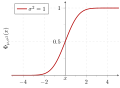 Normal distribution cumulative density function
 -
 Comparison of standard deviations
 -
Standard deviation diagram
-
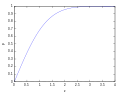 Confidence interval by standard deviation
 -
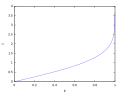 Standard deviation by confidence interval
 -
 Multivariate normal distribution


