Normal distribution: Difference between revisions
CSV import |
CSV import |
||
| Line 35: | Line 35: | ||
{{stub}} | {{stub}} | ||
<gallery> | |||
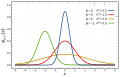
File:Normal_Distribution_PDF.svg|Probability Density Function of a Normal Distribution | |||
File:Normal_Distribution_CDF.svg|Cumulative Distribution Function of a Normal Distribution | |||
File:Standard_deviation_diagram.svg|Standard Deviation Diagram | |||
File:De_moivre-laplace.gif|De Moivre-Laplace Theorem | |||
File:Dice_sum_central_limit_theorem.svg|Central Limit Theorem with Dice Sums | |||
File:Probabilities_of_functions_of_normal_vectors.png|Probabilities of Functions of Normal Vectors | |||
File:QHarmonicOscillator.png|Quantum Harmonic Oscillator | |||
File:Fisher_iris_versicolor_sepalwidth.svg|Fisher Iris Versicolor Sepal Width | |||
File:FitNormDistr.tif|Fitting a Normal Distribution | |||
File:Planche_de_Galton.jpg|Galton Board | |||
File:Carl_Friedrich_Gauss.jpg|Carl Friedrich Gauss | |||
File:Pierre-Simon_Laplace.jpg|Pierre-Simon Laplace | |||
</gallery> | |||
Latest revision as of 12:24, 18 February 2025
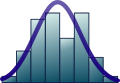
Normal Distribution is a type of probability distribution that is symmetric about the mean, showing that data near the mean are more frequent in occurrence than data far from the mean. In graph form, normal distribution will appear as a bell curve.
Definition[edit]
The normal distribution is defined by the following probability density function:
where:
- is the mean or expectation of the distribution (and also its median and mode),
- is the standard deviation, and
- is the variance.
Properties[edit]
The normal distribution is the most important probability distribution in statistics because it fits many natural phenomena. For example, heights, blood pressure, measurement error, and IQ scores follow the normal distribution. It is also known as the Gaussian distribution and is often denoted by .
Standard Normal Distribution[edit]
The standard normal distribution is a special case of the normal distribution. It is the distribution that occurs when a normal random variable has a mean of zero and a standard deviation of one.
Central Limit Theorem[edit]
The central limit theorem (CLT) states that the distribution of sample means approximates a normal distribution as the sample size gets larger, regardless of the shape of the population distribution.
Applications[edit]
The normal distribution is widely used in understanding distributions of factors in the population, and in determining the significance of sampling data in the social sciences, natural sciences and business.
See Also[edit]
 | |
|---|---|
|
|
 |
-
 Probability Density Function of a Normal Distribution
 -
 Cumulative Distribution Function of a Normal Distribution
 -
 Standard Deviation Diagram
 -
 De Moivre-Laplace Theorem
 -
 Central Limit Theorem with Dice Sums
 -
 Probabilities of Functions of Normal Vectors
 -
 Quantum Harmonic Oscillator
 -
 Fisher Iris Versicolor Sepal Width
 -
 Fitting a Normal Distribution
 -
 Galton Board
 -
 Carl Friedrich Gauss
 -
 Pierre-Simon Laplace


